50% Cheaper (2x Faster) Iceberg Compaction: OLake Fusion (Open Source) Beats Spark


Over the last few years, most data teams have either moved to a lakehouse architecture or are actively moving in that direction. That shift solves several legacy warehouse and data lake limitations, but migration alone is not the finish line. Once you're on a lakehouse, you still need to manage table health carefully to keep performance stable and costs under control.
Most data lakehouse problems are loud. Pipelines fail and errors show up in logs. But there is one problem that stays completely silent. Your queries just get a little slower each day until one morning something that used to finish in seconds is now taking minutes. The reason is almost always small files. In CDC-heavy pipelines, every incremental sync writes a new batch of small data files and delete files into your Iceberg table, and over time these accumulate into thousands of tiny files that make every scan slower and more expensive. The solution is compaction.
But here's the thing not all compaction is the same. The way you compact, how often you compact, and what engine you use to compact can make a dramatic difference in both query performance and resource plus operational cost. That's exactly what we set out to measure in this experiment.
To answer this properly, we ran a controlled benchmark on Apache Iceberg tables under continuous CDC ingestion. We compared Apache Spark's rewrite_data_files with OLake Fusion compaction while keeping the data, infrastructure, and ingestion engine (i.e. OLake Go) exactly the same in both runs. The results were eye-opening.
If you want a conceptual foundation on compaction strategies and tiered maintenance for Iceberg, check out OLake, Apache Amoro™, and the Iceberg Lakehouse Maintenance Playbook.
In this blog, we skip the theory and go straight to the battlefield.
Benchmarking Design:
1. Data
We used the TPC-H dataset (300 GB total across all tables) and focused exclusively on the lineitem table — the largest table in the TPC-H schema. When loaded into Apache Iceberg on Google Cloud Storage, the lineitem table came to approximately 85 GB. The table was unpartitioned in both runs, meaning all files were stored together without any partitioning, so any file count growth from CDC directly impacts how long queries take to scan the table.
2. Source
PostgreSQL served as the OLTP source, where we continuously issued row-level updates every 2 mins to emulate production-like CDC traffic.
3. Destination
Apache Iceberg on Google Cloud Storage was the lakehouse destination, where frequent CDC commits gradually create small files and metadata overhead.
4. Catalog
Lakekeeper served as the Iceberg catalog, managing table metadata, snapshots, and commit coordination consistently across both environments.
5. Ingestion Pipeline
For both environments, we used OLake Go as the ingestion engine — one of the fastest open-source tools for replicating data into Apache Iceberg table format.
The ingestion pipeline ran identically in both environments:
-
OLake Go performed a full load of the lineitem table into Iceberg.
-
A Python script then began continuously updating a string column in the source PostgreSQL lineitem table — 200,000 rows per iteration, cycling endlessly.
Python CDC updater script used in this benchmark
import psycopg2
import time

HOST     = "<POSTGRES_HOST_URI"
PORT     = 5432
USER     = "postgres"
PASSWORD = "<PASSWORD>"
DATABASE = "<DATABASE_NAME"
SCHEMA   = "tpch"
TABLE    = "lineitem"

RUNS             = 120      # total number of runs
INTERVAL_SECONDS = 120      # 2 min between scheduled run starts (see loop below)
TABLESAMPLE_PCT  = 0.0112   # ~200k rows out of 1.8B

print(f"Connecting to {HOST}/{DATABASE} ...")

conn = None
cursor = None

try:
    conn = psycopg2.connect(
        host=HOST,
        port=PORT,
        user=USER,
        password=PASSWORD,
        dbname=DATABASE,
        sslmode="require",
    )
    conn.autocommit = False
    cursor = conn.cursor()
    print("Connected successfully.")
    print(f"Total runs     : {RUNS}")
    print(f"Interval       : every {INTERVAL_SECONDS}s")
    print(f"Rows per run   : ~200k  (TABLESAMPLE SYSTEM {TABLESAMPLE_PCT}%)")

    update_sql = f"""
        UPDATE {SCHEMA}.{TABLE} t
        SET l_comment = substring(l_comment, 1, char_length(l_comment) - 1)
                        || chr(65 + (random() * 25)::int)
        FROM (
            SELECT ctid
            FROM {SCHEMA}.{TABLE} TABLESAMPLE SYSTEM ({TABLESAMPLE_PCT})
        ) s
        WHERE t.ctid = s.ctid
    """

    next_run_monotonic = time.monotonic()

    for run_idx in range(RUNS):
        # First run starts immediately; subsequent runs are anchored to the
        # original start time so interval drift never accumulates.
        if run_idx > 0:
            sleep_seconds = next_run_monotonic - time.monotonic()
            if sleep_seconds > 0:
                print(f"  Sleeping {round(sleep_seconds, 1)}s until next run ...")
                time.sleep(sleep_seconds)
        next_run_monotonic += INTERVAL_SECONDS

        print(f"\n[{run_idx + 1}/{RUNS}] Running UPDATE on {SCHEMA}.{TABLE} - ~200k random rows ...")
        start = time.time()
        cursor.execute(update_sql)
        rows_affected = cursor.rowcount
        conn.commit()
        elapsed = round(time.time() - start, 2)
        print(f"[{run_idx + 1}/{RUNS}] Done. Rows updated: {rows_affected} | Time taken: {elapsed}s")

except Exception as e:
    print(f"ERROR: {e}")
    if conn:
        conn.rollback()
        print("Transaction rolled back.")
    raise

finally:
    if cursor:
        cursor.close()
    if conn:
        conn.close()
print("\nConnection closed.") -
OLake Go was configured to sync every 2 minutes, picking up each batch of updates and writing them to the Iceberg destination as small incremental files. Since these are CDC upserts, each ingestion cycle produces new equality delete files alongside data files — meaning with every sync, both file count and delete-file overhead grow steadily.
This is as close to a real-world production CDC scenario as you can get in a benchmark.
6. Timeline
The total experiment ran for 2 hours and 10 minutes, structured deliberately:
-
First 10 minutes CDC starts and the first 5 ingestion cycles run (one every 2 minutes)
-
After first 2 CDC ingestions TPC-H Query 6 starts executing continuously so we can track query time from the beginning. Here is the query we used:
SELECT
    SUM(l_extendedprice * l_discount) AS revenue
FROM
    lineitem
WHERE
    l_shipdate >= DATE '1994-01-01'
    AND l_shipdate <  DATE '1995-01-01'
    AND l_discount BETWEEN 0.05 AND 0.07
AND l_quantity < 24noteTPC-H Query 6 was kept consistent across both runs to ensure a fair Spark vs Fusion compaction comparison.
-
After first 5 CDC ingestions compaction kicks in to take on the growing small-file load.
-
The 2-hour clock starts the moment compaction kicks in — this is our primary observation window.
This structure gives us three distinct phases to observe: pre-compaction degradation, the immediate post-compaction response, and long-term steady-state performance.
What Happens Without Compaction?
Without compaction, query execution time climbs steadily as each CDC cycle adds more small files. In our earlier benchmark comparing Iceberg query performance with and without compaction, the difference was significant. The full breakdown is available here: Iceberg Compaction: How Much Faster Are TPC-H Queries?
Infrastructure and Resources
To keep this benchmark clean and unbiased, we provisioned Fusion and Spark with equivalent infrastructure and reused the same TPCH query resources in both runs so query conditions stayed identical.
Fusion shows one additional resource because that node runs the Fusion service itself, not extra compaction compute, so it does not create an unfair performance advantage.
- OLake Fusion
- Spark
- TPCH
| Node role | Instance type | vCPUs | RAM |
|---|---|---|---|
| Master | c4a-standard-8 | 8 | 32 GB |
| Worker | c4a-highmem-16 | 16 | 128 GB |
| Worker | c4a-highmem-16 | 16 | 128 GB |
| Node role | Instance type | vCPUs | RAM |
|---|---|---|---|
| Master | c4a-standard-8 | 8 | 32 GB |
| Worker | c4a-highmem-16 | 16 | 128 GB |
| Worker | c4a-highmem-16 | 16 | 128 GB |
| Node role | Instance type | vCPUs | RAM |
|---|---|---|---|
| Master | c4a-standard-8 | 8 | 32 GB |
| Worker | c4a-standard-32 | 32 | 128 GB |
| Worker | c4a-standard-32 | 32 | 128 GB |
Compaction Setup and Configuration
1. OLake Fusion Configuration
OLake Fusion takes a tiered compaction approach, giving you three levels of optimization that can be scheduled independently based on how aggressively you want to maintain your tables.
All three compaction tiers are explained there in detail, so definitely check out the OLake Iceberg Maintenance docs.
For this benchmark, we used a 512 MB target file size, so each tier behaves as follows:
- Lite: Files smaller than 64 MB (1/8 of 512 MB) are merged into approximately 64 MB output files. Fast, low-cost, and suitable for frequent runs during active ingestion.
- Medium: Deletes are applied and files are merged into outputs that typically range from 64 MB to 512 MB, depending on available data in each optimization cycle.
- Full: Performs a complete table rewrite to align output files close to the 512 MB target, used when deeper cleanup and maximum query performance are required.
We used the following Fusion cluster configuration for running the compaction:
| Setting | Value |
|---|---|
spark-conf.spark.executor.instances | 4 |
spark-conf.spark.executor.cores | 7 |
spark-conf.spark.executor.memory | 45g |
spark-conf.spark.executor.memoryOverhead | 12g |
spark-conf.spark.driver.memory | 18g |
spark-conf.spark.driver.memoryOverhead | 9g |
spark.dynamicAllocation.enabled | false |
Fusion runs table optimization on Spark, and these spark-conf values size that workload: enough executors and cores to keep compaction moving in parallel, and enough memory overall so rewrite and merge steps are not constantly fighting for space.
How We Scheduled It
For this experiment, Fusion ran on the following schedule:
- Lite compaction: every 20 minutes
- Medium compaction: every 40 minutes
- We intentionally skipped Full compaction in this benchmark because the observation window and total data size were quite small. It would have had limited time to show its optimal long-term impact, so including it would likely not have changed the results meaningfully.
- Even without Full compaction, Fusion's query performance remained competitive with Spark throughout the experiment, which shows that Lite and Medium alone are sufficient for short to medium-term CDC workloads.
- Full compaction becomes most valuable after several days or even a week of ingestion, when Medium compaction has accumulated a large number of files in the size range between the target file size and one-eighth of it. At that point a Full rewrite consolidates everything cleanly.
Compaction Parameters
We used the following parameters for the compaction:
target-file-size-bytes: 512 MB (the desired output file size after compaction)
By default, max-task-size-bytes is set to the same value as target-file-size-bytes.
2. Spark Configuration
Spark's rewrite_data_files is the standard compaction tool in the Iceberg ecosystem for Spark-based environments. It rewrites data files based on configurable size bounds, consolidating fragmented files into right-sized outputs.
We used the following Spark cluster configuration for running the compaction:
| Setting | Value |
|---|---|
spark.executor.instances | 4 |
spark.executor.cores | 7 |
spark.executor.memory | 45g |
spark.executor.memoryOverhead | 12g |
spark.driver.memory | 18g |
spark.driver.memoryOverhead | 10g |
spark.dynamicAllocation.enabled | false |
This configuration was chosen to balance parallelism and memory for Iceberg compaction. We used 4 executors with 7 cores each so rewrite_data_files could drive enough concurrent work, while keeping generous executor memory because compaction is memory-intensive (reads, shuffles, merges, and writes) and too little memory tends to slow the job down or even lead to OOM crashes.
Compaction Parameters
We used the following parameters for the compaction:
target-file-size-bytes: 512 MB
Spark tries to produce output files close to 512 MB after compaction.max-file-size-bytes: 614 MB
Any file larger than 614 MB is treated as oversized and selected for rewrite.min-file-size-bytes: 384 MB
Any file smaller than 384 MB is treated as undersized and selected for merge.max-concurrent-file-group-rewrites: 28
Spark can rewrite up to 28 file groups at the same time, which controls compaction parallelism.partial-progress.enabled: false
Spark commits only if the entire compaction job succeeds; partial results are not committed.delete-file-threshold: 1
If a data file has even 1 delete file attached, Spark includes it in compaction.
How We Scheduled It
In this experiment, Spark compaction was scheduled to run every 20 minutes. We kept this interval fixed to reflect a practical CDC maintenance pattern, where small files keep accumulating and need regular cleanup.
Python script used to run Spark compaction
#!/usr/bin/env python3
import logging
import time
import datetime
from pyspark.sql import SparkSession


# Logging Setup
logging.basicConfig(
    level=logging.INFO,
    format="%(asctime)s [%(levelname)s] %(message)s",
    datefmt="%Y-%m-%d %H:%M:%S",
)
log = logging.getLogger("iceberg-compaction")


CATALOG  = "benchmark"
DATABASE = "spark_compact"
TABLES   = [
    "lineitem",
]


# Scheduler Config
TOTAL_RUNS        = 20
INTERVAL_MINUTES  = 20
INTERVAL_SECONDS  = INTERVAL_MINUTES * 60


# TPC-H Q6 - Forecasting Revenue Change
def build_tpch_q6(catalog, db):
    return {
        "Q6 - Forecasting Revenue Change": f"""
            SELECT
                SUM(l_extendedprice * l_discount) AS revenue
            FROM
                {catalog}.{db}.lineitem
            WHERE
                l_shipdate >= date '1994-01-01'
                AND l_shipdate <  date '1995-01-01'
                AND l_discount BETWEEN 0.05 AND 0.07
                AND l_quantity < 24
        """
    }


# Helper: Per-table file stats (optionally pinned to a snapshot)
def get_table_file_stats(spark, catalog, table_full, snapshot_id=None):
    """
    content = 0 -> data files
    content = 2 -> equality delete files
    snapshot_id -> if provided, reads file state at that exact snapshot (time travel)
                   if None, reads current state
    """
    version_clause = f"VERSION AS OF {snapshot_id}" if snapshot_id else ""

    try:
        row = spark.sql(
            f"SELECT COUNT(*) AS file_count, SUM(file_size_in_bytes) AS total_bytes "
            f"FROM {catalog}.{table_full}.files {version_clause} WHERE content = 0"
        ).collect()[0]
        data_count = row["file_count"]
        data_mb    = round(row["total_bytes"] / (1024 * 1024), 2) if row["total_bytes"] else 0
    except Exception as e:
        log.warning(f"    Could not fetch data file stats: {e}")
        data_count, data_mb = "N/A", "N/A"

    try:
        eq_count = spark.sql(
            f"SELECT COUNT(*) AS file_count "
            f"FROM {catalog}.{table_full}.files {version_clause} WHERE content = 2"
        ).collect()[0]["file_count"]
    except Exception as e:
        log.warning(f"    Could not fetch equality delete file stats: {e}")
        eq_count = "N/A"

    return data_count, data_mb, eq_count


# Helper: Find the snapshot ID that compaction created
def get_compaction_snapshot(spark, catalog, table_full, compaction_started_at):
    """
    After rewrite_data_files completes, find the snapshot with operation='replace'
    that was committed after compaction started. This is the exact compaction snapshot.
    Returns (snapshot_id, committed_at) or (None, None) if nothing was rewritten.
    """
    try:
        rows = spark.sql(
            f"SELECT snapshot_id, committed_at "
            f"FROM {catalog}.{table_full}.snapshots "
            f"WHERE operation = 'replace' "
            f"AND committed_at >= TIMESTAMP '{compaction_started_at}' "
            f"ORDER BY committed_at ASC "
            f"LIMIT 1"
        ).collect()
        if rows:
            snap_id = rows[0]["snapshot_id"]
            snap_ts = str(rows[0]["committed_at"])
            log.info(f"  Compaction snapshot found : id={snap_id} | committed_at={snap_ts}")
            return snap_id, snap_ts
        else:
            log.warning(f"  No replace snapshot found after {compaction_started_at} - "
                        f"compaction may have found nothing to rewrite.")
            return None, None
    except Exception as e:
        log.warning(f"  Could not find compaction snapshot: {e}")
        return None, None


# Helper: Count OLake ingestion appends during compaction window
def count_ingestions_during_compaction(spark, catalog, table_full,
                                       pre_committed_at, compaction_committed_at):
    """
    Counts append snapshots committed strictly AFTER pre_committed_at and
    up to AND INCLUDING compaction_committed_at.

    Each OLake ingestion commit adds exactly: 1 data file + 1 equality-delete file.
    We subtract this count from the raw POST snapshot counts to isolate the
    pure compaction effect (no ingestion noise).

    Returns 0 safely if either timestamp is None.
    """
    if not pre_committed_at or not compaction_committed_at:
        log.warning("  Skipping ingestion count - missing pre or compaction timestamp.")
        return 0
    try:
        row = spark.sql(
            f"SELECT COUNT(*) AS cnt "
            f"FROM {catalog}.{table_full}.snapshots "
            f"WHERE operation IN ('append', 'overwrite') "
            f"AND committed_at > TIMESTAMP '{pre_committed_at}' "
            f"AND committed_at <= TIMESTAMP '{compaction_committed_at}'"
        ).collect()[0]
        cnt = row["cnt"]
        log.info(f"  OLake ingestion commits during compaction window : {cnt} "
                 f"(each = +1 data file, +1 eq-delete file)")
        return cnt
    except Exception as e:
        log.warning(f"  Could not count ingestion snapshots during compaction: {e}")
        return 0


# Helper: Run TPC-H Q6 and return elapsed time
def run_tpch_q6(spark, label, tpch_queries):
    log.info("=" * 70)
    log.info(f"  TPC-H Query Benchmark  [{label}]")
    log.info("=" * 70)
    results = {}
    for qname, qsql in tpch_queries.items():
        try:
            q_start   = time.time()
            spark.sql(qsql).collect()
            q_elapsed = round(time.time() - q_start, 2)
            log.info(f"    {qname:<40} : {q_elapsed}s  ({round(q_elapsed / 60, 2)} min)")
            results[qname] = q_elapsed
        except Exception as e:
            log.warning(f"    {qname:<40} : FAILED - {e}")
            results[qname] = "FAILED"
    log.info("=" * 70)
    return results


# Core compaction logic for a single run
def run_compaction(spark, run_number, tpch_queries):
    overall_start_time = time.time()
    overall_start_ts   = datetime.datetime.now().strftime("%Y-%m-%d %H:%M:%S")

    log.info("=" * 70)
    log.info(f"  OVERALL COMPACTION RUN STARTED AT : {overall_start_ts}")
    log.info(f"  Tables to compact                 : {TABLES}")
    log.info("=" * 70)

    for table_name in TABLES:
        TABLE      = f"{DATABASE}.{table_name}"
        FULL_TABLE = f"{CATALOG}.{TABLE}"

        log.info("")
        log.info("=" * 70)
        log.info(f"  TABLE: {FULL_TABLE}")
        log.info("=" * 70)

        # Last 5 snapshots - pre
        try:
            snaps = spark.sql(
                f"SELECT snapshot_id, committed_at, operation "
                f"FROM {CATALOG}.{TABLE}.snapshots "
                f"ORDER BY committed_at DESC LIMIT 5"
            ).collect()
            log.info("  [PRE] Last 5 snapshots:")
            for row in snaps:
                log.info(f"    snapshot_id={row['snapshot_id']} | "
                         f"committed_at={row['committed_at']} | "
                         f"operation={row['operation']}")
        except Exception as e:
            log.warning(f"  Could not fetch pre-compaction snapshots: {e}")

        # File stats - pre
        data_cnt, data_mb, eq_del_cnt = get_table_file_stats(spark, CATALOG, TABLE)
        log.info(f"  [PRE]  Data files        (content=0) : {data_cnt} files | {data_mb} MB")
        log.info(f"  [PRE]  Eq-delete files   (content=2) : {eq_del_cnt} files")

        # Capture PRE boundary timestamp inline - same snapshot the PRE stats just read from.
        # Used as the left edge of the ingestion-counting window.
        pre_committed_at = None
        try:
            pre_row = spark.sql(
                f"SELECT committed_at FROM {CATALOG}.{TABLE}.snapshots "
                f"ORDER BY committed_at DESC LIMIT 1"
            ).collect()
            pre_committed_at = str(pre_row[0]["committed_at"]) if pre_row else None
            log.info(f"  [PRE]  Snapshot boundary          : {pre_committed_at}")
        except Exception as e:
            log.warning(f"  Could not fetch PRE snapshot boundary: {e}")

        # Disable vectorization at table level
        try:
            spark.sql(
                f"ALTER TABLE {FULL_TABLE} "
                f"SET TBLPROPERTIES ('read.parquet.vectorization.enabled' = 'false')"
            )
            log.info(f"  Disabled vectorization for {table_name}.")
        except Exception as e:
            log.warning(f"  Could not set vectorization property: {e}")

        # Compaction config banner
        log.info("  Compaction config:")
        log.info("    strategy                          : binpack")
        log.info("    target-file-size-bytes            : 536870912  (512 MB)")
        log.info("    max-file-size-bytes               : 644245094  (614.4 MB)")
        log.info("    min-file-size-bytes               : 402653184  (384 MB)")
        log.info("    max-concurrent-file-group-rewrites: 28")
        log.info("    partial-progress.enabled          : false")
        log.info("    delete-file-threshold             : 1")

        table_start_time = time.time()
        table_start_ts   = datetime.datetime.now().strftime("%Y-%m-%d %H:%M:%S")
        log.info(f"  Compaction started at : {table_start_ts}")

        try:
            result = spark.sql(
                f"""
                CALL {CATALOG}.system.rewrite_data_files(
                    table    => '{TABLE}',
                    strategy => 'binpack',
                    options  => map(
                        'target-file-size-bytes',             '536870912',
                        'max-file-size-bytes',                '644245094',
                        'min-file-size-bytes',                '402653184',
                        'max-concurrent-file-group-rewrites', '28',
                        'partial-progress.enabled',           'false',
                        'delete-file-threshold',               '1'
                    )
                )
                """
            )
            rows          = result.collect()
            table_elapsed = round(time.time() - table_start_time, 2)
            table_end_ts  = datetime.datetime.now().strftime("%Y-%m-%d %H:%M:%S")

            log.info(f"  Compaction finished at        : {table_end_ts}")
            log.info(f"  Compaction time for this table: {table_elapsed}s  "
                     f"({round(table_elapsed / 60, 2)} min)")

            for row in rows:
                rewritten_files = row["rewritten_data_files_count"]
                added_files     = row["added_data_files_count"]
                rewritten_bytes = (
                    row["rewritten_bytes_count"]
                    if "rewritten_bytes_count" in row.__fields__
                    else "N/A"
                )
                rewritten_mb = (
                    round(rewritten_bytes / (1024 * 1024), 2)
                    if isinstance(rewritten_bytes, int)
                    else "N/A"
                )
                log.info("  Compaction Result:")
                log.info(f"    Files rewritten (input) : {rewritten_files}")
                log.info(f"    Files added (output)    : {added_files}")
                log.info(f"    Total bytes rewritten   : {rewritten_bytes}  ({rewritten_mb} MB)")

        except Exception as e:
            elapsed = round(time.time() - table_start_time, 2)
            log.error(f"  Compaction FAILED for {table_name} after {elapsed}s")
            log.error(f"  Error: {e}")
            continue

        # Step 1: Find the exact compaction snapshot (operation=replace)
        compaction_snapshot_id, compaction_committed_at = get_compaction_snapshot(
            spark, CATALOG, TABLE, table_start_ts
        )

        # Step 2: Count OLake ingestions that committed DURING compaction
        # Window: strictly after PRE snapshot -> up to and including compaction snapshot
        # Each ingestion = +1 data file, +1 eq-delete file (OLake guarantee)
        ingestions_during_compaction = count_ingestions_during_compaction(
            spark, CATALOG, TABLE, pre_committed_at, compaction_committed_at
        )

        # Step 3: Read POST file counts pinned to the compaction snapshot
        data_cnt_p, data_mb_p, eq_del_cnt_p = get_table_file_stats(
            spark, CATALOG, TABLE, snapshot_id=compaction_snapshot_id
        )

        # Step 4: Subtract ingestion noise -> pure compaction POST counts
        # The compaction snapshot inherits ingested files via Iceberg's linear chain.
        # Subtracting ingestions_during_compaction isolates the compaction-only effect.
        true_data_cnt_p   = (
            data_cnt_p - ingestions_during_compaction
            if isinstance(data_cnt_p, int)
            else data_cnt_p
        )
        true_eq_del_cnt_p = (
            eq_del_cnt_p - ingestions_during_compaction
            if isinstance(eq_del_cnt_p, int)
            else eq_del_cnt_p
        )

        if compaction_snapshot_id:
            log.info(f"  [POST] File stats pinned to compaction snapshot {compaction_snapshot_id}:")
        else:
            log.info(f"  [POST] File stats (no replace snapshot found - showing current state):")

        log.info(f"  [POST] Data files (content=0) at snapshot   : {data_cnt_p} files")
        log.info(f"  [POST] Eq-delete  (content=2) at snapshot   : {eq_del_cnt_p} files")
        log.info(f"  [POST] Minus ingestion files during window  : -{ingestions_during_compaction} (data), -{ingestions_during_compaction} (eq-delete)")
        log.info(f"  [POST] True post-compaction data files      : {true_data_cnt_p} files | {data_mb_p} MB")
        log.info(f"  [POST] True post-compaction eq-delete files : {true_eq_del_cnt_p} files")

        # Delta - pure compaction effect only
        if isinstance(data_cnt, int) and isinstance(true_data_cnt_p, int):
            log.info(f"  [DELTA] Data files   : {data_cnt} -> {true_data_cnt_p}  "
                     f"(change: {true_data_cnt_p - data_cnt:+d})")
        if isinstance(eq_del_cnt, int) and isinstance(true_eq_del_cnt_p, int):
            log.info(f"  [DELTA] Eq-del files : {eq_del_cnt} -> {true_eq_del_cnt_p}  "
                     f"(change: {true_eq_del_cnt_p - eq_del_cnt:+d})")

        # Last 3 snapshots - post
        try:
            snaps_after = spark.sql(
                f"SELECT snapshot_id, committed_at, operation "
                f"FROM {CATALOG}.{TABLE}.snapshots "
                f"ORDER BY committed_at DESC LIMIT 3"
            ).collect()
            log.info("  [POST] Latest snapshots:")
            for row in snaps_after:
                log.info(f"    snapshot_id={row['snapshot_id']} | "
                         f"committed_at={row['committed_at']} | "
                         f"operation={row['operation']}")
        except Exception as e:
            log.warning(f"  Could not fetch post-compaction snapshots: {e}")

    # Per-run Summary
    overall_elapsed = round(time.time() - overall_start_time, 2)
    overall_end_ts  = datetime.datetime.now().strftime("%Y-%m-%d %H:%M:%S")

    log.info("")
    log.info("=" * 70)
    log.info(f"  RUN {run_number} - COMPACTION SUMMARY")
    log.info("=" * 70)
    log.info(f"  Started at  : {overall_start_ts}")
    log.info(f"  Ended at    : {overall_end_ts}")
    log.info(f"  Total time  : {overall_elapsed}s  ({round(overall_elapsed / 60, 2)} min)")
    log.info("=" * 70)


# SPARK SESSION
log.info("Initializing SparkSession...")
spark = (
    SparkSession.builder
    .appName("iceberg-compaction-tpch-spark_compact")
    .config("spark.sql.extensions",
            "org.apache.iceberg.spark.extensions.IcebergSparkSessionExtensions")
    .config("spark.sql.catalog.benchmark",
            "org.apache.iceberg.spark.SparkCatalog")
    .config("spark.sql.catalog.benchmark.catalog-impl",
            "org.apache.iceberg.rest.RESTCatalog")
    .config("spark.sql.catalog.benchmark.uri",
            "http://10.20.0.64:30081/catalog")
    .config("spark.sql.catalog.benchmark.warehouse",
            "benchmarking")
    .config("spark.sql.catalog.benchmark.io-impl",
            "org.apache.iceberg.aws.s3.S3FileIO")
    .config("spark.sql.catalog.benchmark.s3.endpoint",
            "https://storage.googleapis.com/")
    .config("spark.sql.catalog.benchmark.s3.path-style-access", "true")
    .config("spark.sql.catalog.benchmark.client.region",        "ap-south-1")
    .config("spark.hadoop.fs.s3a.endpoint",                     "https://storage.googleapis.com")
    .config("spark.hadoop.fs.s3a.path.style.access",            "true")
    .config("spark.hadoop.fs.s3a.endpoint.region",              "ap-south-1")
    .config("spark.sql.shuffle.partitions",                     "128")
    .config("spark.sql.defaultCatalog",                         "benchmark")
    .getOrCreate()
)

spark.conf.set("spark.sql.iceberg.vectorization.enabled", "false")
spark.sparkContext.setLogLevel("INFO")

log.info("SparkSession initialized successfully.")
log.info(f"  Spark version       : {spark.version}")
log.info(f"  App name            : {spark.sparkContext.appName}")
log.info(f"  Master              : {spark.sparkContext.master}")
log.info(f"  Default parallelism : {spark.sparkContext.defaultParallelism}")

TPCH_QUERIES = build_tpch_q6(CATALOG, DATABASE)


# SCHEDULED LOOP
schedule_anchor = time.time()

for run_number in range(1, TOTAL_RUNS + 1):

    scheduled_start = schedule_anchor + (run_number - 1) * INTERVAL_SECONDS
    now             = time.time()
    wait_seconds    = scheduled_start - now

    if wait_seconds > 0:
        next_run_ts = datetime.datetime.fromtimestamp(scheduled_start).strftime("%Y-%m-%d %H:%M:%S")
        log.info("")
        log.info("~" * 70)
        log.info(f"  Waiting {round(wait_seconds, 1)}s until next scheduled run at {next_run_ts} ...")
        log.info("~" * 70)
        time.sleep(wait_seconds)

    log.info("")
    log.info("#" * 70)
    log.info(f"#{'':^68}#")
    log.info(f"#{'RUN ' + str(run_number) + ' OF ' + str(TOTAL_RUNS):^68}#")
    log.info(f"#{'':^68}#")
    log.info("#" * 70)

    run_compaction(spark, run_number, TPCH_QUERIES)

    log.info("")
    log.info("-" * 70)
    log.info(f"  END OF RUN {run_number} OF {TOTAL_RUNS}")
    log.info("-" * 70)

    remaining = TOTAL_RUNS - run_number
    if remaining > 0:
        log.info(f"  Remaining runs : {remaining}")
        for future_run in range(run_number + 1, TOTAL_RUNS + 1):
            future_ts = datetime.datetime.fromtimestamp(
                schedule_anchor + (future_run - 1) * INTERVAL_SECONDS
            ).strftime("%Y-%m-%d %H:%M:%S")
            log.info(f"    Run {future_run} scheduled at : {future_ts}")
    else:
        log.info("  All scheduled runs completed. No further runs.")
    log.info("-" * 70)


# ALL RUNS DONE
log.info("")
log.info("=" * 70)
log.info("  ALL COMPACTION RUNS FINISHED")
log.info(f"  Total runs executed : {TOTAL_RUNS}")
log.info(f"  Interval            : every {INTERVAL_MINUTES} minute(s)")
log.info("=" * 70)
log.info("")
log.info("All done. Stopping SparkSession.")
spark.stop()
Spark-submit command used to run this script
gcloud dataproc jobs submit pyspark gs://dz-benchmark/dataproc_compaction.py \
  --cluster=dz-olake-compaction-21042026 \
  --region=asia-south1 \
  --properties="^#^spark.jars.packages=org.apache.iceberg:iceberg-spark-runtime-3.5_2.12:1.7.2,org.apache.iceberg:iceberg-aws-bundle:1.7.2#spark.sql.extensions=org.apache.iceberg.spark.extensions.IcebergSparkSessionExtensions#spark.sql.catalog.benchmark=org.apache.iceberg.spark.SparkCatalog#spark.sql.catalog.benchmark.catalog-impl=org.apache.iceberg.rest.RESTCatalog#spark.sql.catalog.benchmark.uri=http://10.20.0.64:30081/catalog#spark.sql.catalog.benchmark.warehouse=benchmarking#spark.sql.catalog.benchmark.io-impl=org.apache.iceberg.aws.s3.S3FileIO#spark.sql.catalog.benchmark.s3.endpoint=https://storage.googleapis.com/#spark.sql.catalog.benchmark.s3.path-style-access=true#spark.sql.catalog.benchmark.client.region=ap-south-1#spark.sql.defaultCatalog=benchmark#spark.hadoop.fs.s3a.endpoint=https://storage.googleapis.com#spark.hadoop.fs.s3a.path.style.access=true#spark.hadoop.fs.s3a.endpoint.region=ap-south-1#spark.dynamicAllocation.enabled=false#spark.executor.instances=4#spark.executor.cores=7#spark.executor.memory=45g#spark.executor.memoryOverhead=12g#spark.driver.memory=18g#spark.driver.memoryOverhead=10g#spark.sql.parquet.enableVectorizedReader=false#spark.sql.iceberg.vectorization.enabled=false#spark.hadoop.io.native.lib.available=false#spark.executor.extraJavaOptions=-XX:+UseG1GC -XX:InitiatingHeapOccupancyPercent=35 -XX:G1ReservePercent=20 -XX:UseAVX=0 -Darrow.enable_unsafe_memory_access=false -Darrow.enable_null_check_for_get=true -Dhadoop.io.native.lib.available=false#spark.driver.extraJavaOptions=-XX:+UseG1GC -XX:InitiatingHeapOccupancyPercent=35 -Xss8m -XX:UseAVX=0 -Darrow.enable_unsafe_memory_access=false -Darrow.enable_null_check_for_get=true"
TPC-H Query Execution
TPC-H Query 6 is a scan-heavy analytical query with filter predicates, making it extremely sensitive to file count and layout. It's the perfect canary for detecting compaction effectiveness.
Alongside compaction, we ran TPC-H Query 6 continuously throughout the experiment with no wait time between runs - each new execution started immediately after the previous one finished. This allowed us to capture performance across all table states (before compaction, immediately after compaction, and later as new CDC files accumulated) and compute an unbiased average without overrepresenting any single phase.
We used the following Spark cluster configuration for TPC-H Query 6 runs:
| Setting | Value |
|---|---|
spark.executor.instances | 12 |
spark.executor.cores | 5 |
spark.executor.memory | 15g |
spark.executor.memoryOverhead | 4g |
spark.driver.memory | 18g |
spark.driver.memoryOverhead | 10g |
spark.dynamicAllocation.enabled | false |
This configuration was chosen to keep Query 6 execution consistently fast by prioritizing parallelism (more executors and cores) while using practical memory limits. Since Query 6 is mostly scan-heavy rather than memory-heavy, this setup delivers better throughput without unnecessary memory over-provisioning.
Python script used to execute TPC-H Query 6
#!/usr/bin/env python3
import logging
import time
import datetime
from pyspark.sql import SparkSession

# Logging Setup
logging.basicConfig(
    level=logging.INFO,
    format="%(asctime)s [%(levelname)s] %(message)s",
    datefmt="%Y-%m-%d %H:%M:%S",
)
log = logging.getLogger("tpch-benchmark")

CATALOG  = "benchmark"
# Iceberg namespace in Lakekeeper (REST catalog); must hold `lineitem`.
DATABASE = "spark_compact"
# Lakekeeper REST catalog warehouse id (matches spark.sql.catalog.benchmark.warehouse).
LAKEKEEPER_WAREHOUSE = "benchmarking"
LAKEKEEPER_URI = "http://10.20.0.64:30081/catalog"

# Run Config
TOTAL_RUNS = 200
BREAK_SECONDS = 0  # no pause between runs

# TPC-H Q6 - Forecasting Revenue Change
# Single table scan on lineitem only. No joins, no GROUP BY.
# Pure sequential scan - best query to measure compaction impact.
TPCH_Q6 = f"""
    SELECT
        SUM(l_extendedprice * l_discount) AS revenue
    FROM
        {CATALOG}.{DATABASE}.lineitem
    WHERE
        l_shipdate >= DATE '1994-01-01'
        AND l_shipdate <  DATE '1995-01-01'
        AND l_discount BETWEEN 0.05 AND 0.07
        AND l_quantity < 24
"""

# SparkSession
log.info("Initializing SparkSession...")
spark = (
    SparkSession.builder
    .appName("tpch-q6-benchmark")
    .config("spark.sql.extensions",
            "org.apache.iceberg.spark.extensions.IcebergSparkSessionExtensions")
    .config("spark.sql.catalog.benchmark",
            "org.apache.iceberg.spark.SparkCatalog")
    .config("spark.sql.catalog.benchmark.catalog-impl",
            "org.apache.iceberg.rest.RESTCatalog")
    .config("spark.sql.catalog.benchmark.uri",
            LAKEKEEPER_URI)
    .config("spark.sql.catalog.benchmark.warehouse",
            LAKEKEEPER_WAREHOUSE)
    .config("spark.sql.catalog.benchmark.io-impl",
            "org.apache.iceberg.aws.s3.S3FileIO")
    .config("spark.sql.catalog.benchmark.s3.endpoint",
            "https://storage.googleapis.com/")
    .config("spark.sql.catalog.benchmark.s3.path-style-access", "true")
    .config("spark.sql.catalog.benchmark.client.region",        "ap-south-1")
    .config("spark.hadoop.fs.s3a.endpoint",                     "https://storage.googleapis.com")
    .config("spark.hadoop.fs.s3a.path.style.access",            "true")
    .config("spark.hadoop.fs.s3a.endpoint.region",              "ap-south-1")
    .config("spark.sql.shuffle.partitions",                     "128")
    .config("spark.sql.defaultCatalog",                         "benchmark")
    .getOrCreate()
)

spark.conf.set("spark.sql.iceberg.vectorization.enabled", "false")
spark.sparkContext.setLogLevel("INFO")

log.info("SparkSession initialized successfully.")
log.info(f"  Spark version       : {spark.version}")
log.info(f"  App name            : {spark.sparkContext.appName}")
log.info(f"  Master              : {spark.sparkContext.master}")
log.info(f"  Default parallelism : {spark.sparkContext.defaultParallelism}")
log.info(f"  Lakekeeper URI      : {LAKEKEEPER_URI}")
log.info(f"  Catalog warehouse   : {LAKEKEEPER_WAREHOUSE}")
log.info(f"  Namespace (db)      : {DATABASE}")
log.info(f"  Total Q6 runs       : {TOTAL_RUNS}")
log.info(f"  Break between runs  : {BREAK_SECONDS}s")

run_results = []  # {run, started_at, finished_at, elapsed_s, revenue, status}

# BENCHMARK LOOP - Q6 x TOTAL_RUNS, no pause between runs
for run_number in range(1, TOTAL_RUNS + 1):
    log.info("")
    log.info("#" * 70)
    log.info(f"#{'':^68}#")
    log.info(f"#{'RUN ' + str(run_number) + ' OF ' + str(TOTAL_RUNS):^68}#")
    log.info(f"#{'':^68}#")
    log.info("#" * 70)

    log.info("")
    log.info("=" * 70)
    log.info("  TPC-H Q6 - Forecasting Revenue Change")
    log.info(f"  Table  : {CATALOG}.{DATABASE}.lineitem")
    log.info("  Type   : Single table scan | No joins | No GROUP BY")
    log.info("=" * 70)

    run_start_ts = datetime.datetime.now().strftime("%Y-%m-%d %H:%M:%S")
    log.info(f"  Query started at : {run_start_ts}")

    q_start = time.time()
    try:
        result = spark.sql(TPCH_Q6)
        rows = result.collect()
        q_elapsed = round(time.time() - q_start, 2)
        run_end_ts = datetime.datetime.now().strftime("%Y-%m-%d %H:%M:%S")

        revenue_val = rows[0]["revenue"] if rows else None

        log.info(f"  Query finished at : {run_end_ts}")
        log.info(f"  Query time        : {q_elapsed}s  ({round(q_elapsed / 60, 2)} min)")
        log.info("")
        log.info("  Result:")
        log.info(f"    revenue = {revenue_val}")

        run_results.append({
            "run": run_number,
            "started_at": run_start_ts,
            "finished_at": run_end_ts,
            "elapsed_s": q_elapsed,
            "revenue": revenue_val,
            "status": "OK",
        })

    except Exception as e:
        q_elapsed = round(time.time() - q_start, 2)
        run_end_ts = datetime.datetime.now().strftime("%Y-%m-%d %H:%M:%S")
        log.error("=" * 70)
        log.error(f"  Q6 FAILED after {q_elapsed}s")
        log.error(f"  Error: {e}")
        log.error("=" * 70)
        run_results.append({
            "run": run_number,
            "started_at": run_start_ts,
            "finished_at": run_end_ts,
            "elapsed_s": q_elapsed,
            "revenue": None,
            "status": f"FAILED: {e}",
        })

    log.info("")
    log.info("-" * 70)
    log.info(f"  END OF RUN {run_number} OF {TOTAL_RUNS}")
    log.info(f"  Elapsed : {q_elapsed}s  ({round(q_elapsed / 60, 2)} min)")
    remaining = TOTAL_RUNS - run_number
    if remaining > 0:
        log.info(f"  Remaining runs : {remaining}")
    else:
        log.info("  All runs completed.")
    log.info("-" * 70)

    if remaining > 0 and BREAK_SECONDS > 0:
        log.info(f"  Cooling down for {BREAK_SECONDS}s before next run...")
        time.sleep(BREAK_SECONDS)

# FINAL SUMMARY
log.info("")
log.info("=" * 70)
log.info("  BENCHMARK COMPLETE - ALL RUNS SUMMARY")
log.info("=" * 70)
log.info(f"  {'RUN':<6} {'STARTED AT':<22} {'ELAPSED (s)':<14} {'STATUS'}")
log.info(f"  {'-'*4:<6} {'-'*19:<22} {'-'*11:<14} {'-'*10}")

ok_times = []
for r in run_results:
    elapsed_str = str(r["elapsed_s"]) if r["status"] == "OK" else "FAILED"
    log.info(f"  {r['run']:<6} {r['started_at']:<22} {elapsed_str:<14} {r['status']}")
    if r["status"] == "OK":
        ok_times.append(r["elapsed_s"])

log.info("")
if ok_times:
    log.info(f"  Successful runs   : {len(ok_times)} / {TOTAL_RUNS}")
    log.info(f"  Min query time    : {min(ok_times)}s")
    log.info(f"  Max query time    : {max(ok_times)}s")
    log.info(f"  Avg query time    : {round(sum(ok_times) / len(ok_times), 2)}s")
    log.info(f"  Total query time  : {round(sum(ok_times), 2)}s  "
             f"({round(sum(ok_times) / 60, 2)} min)")
else:
    log.error("  No successful runs to summarize.")

log.info("=" * 70)
log.info("")
log.info("All done. Stopping SparkSession.")
spark.stop()
Spark-submit command used for the TPC-H query script
gcloud dataproc jobs submit pyspark gs://dz-benchmark/tpch_dataproc.py \
  --cluster=dz-olake-tpch-21042026 \
  --region=asia-south1 \
  --properties="^#^spark.jars.packages=org.apache.iceberg:iceberg-spark-runtime-3.5_2.12:1.7.2,org.apache.iceberg:iceberg-aws-bundle:1.7.2#spark.sql.extensions=org.apache.iceberg.spark.extensions.IcebergSparkSessionExtensions#spark.sql.catalog.benchmark=org.apache.iceberg.spark.SparkCatalog#spark.sql.catalog.benchmark.catalog-impl=org.apache.iceberg.rest.RESTCatalog#spark.sql.catalog.benchmark.uri=http://10.20.0.64:30081/catalog#spark.sql.catalog.benchmark.warehouse=benchmarking#spark.sql.catalog.benchmark.io-impl=org.apache.iceberg.aws.s3.S3FileIO#spark.sql.catalog.benchmark.s3.endpoint=https://storage.googleapis.com/#spark.sql.catalog.benchmark.s3.path-style-access=true#spark.sql.catalog.benchmark.client.region=ap-south-1#spark.sql.defaultCatalog=benchmark#spark.hadoop.fs.s3a.endpoint=https://storage.googleapis.com#spark.hadoop.fs.s3a.path.style.access=true#spark.hadoop.fs.s3a.endpoint.region=ap-south-1#spark.dynamicAllocation.enabled=false#spark.executor.instances=12#spark.executor.cores=5#spark.executor.memory=15g#spark.executor.memoryOverhead=4g#spark.driver.memory=18g#spark.driver.memoryOverhead=10g#spark.sql.parquet.enableVectorizedReader=false#spark.sql.iceberg.vectorization.enabled=false#spark.hadoop.io.native.lib.available=false#spark.executor.extraJavaOptions=-XX:+UseG1GC -XX:InitiatingHeapOccupancyPercent=35 -XX:G1ReservePercent=20 -XX:UseAVX=0 -Darrow.enable_unsafe_memory_access=false -Darrow.enable_null_check_for_get=true -Dhadoop.io.native.lib.available=false#spark.driver.extraJavaOptions=-XX:+UseG1GC -XX:InitiatingHeapOccupancyPercent=35 -Xss8m -XX:UseAVX=0 -Darrow.enable_unsafe_memory_access=false -Darrow.enable_null_check_for_get=true"
Benchmark Results: Who Actually Wins?
To make this comparison fair, we first made sure query execution behavior stayed as aligned as possible across both setups. Our goal was to avoid drawing conclusions from query-pattern differences and instead focus on what we actually wanted to compare: compaction time, resource usage, and cost for Spark vs Fusion.
Once query-time behavior was in a similar range, we had a stable baseline for evaluating the other constraints honestly. That let us compare both systems on operational efficiency, not just raw query outcomes.
1. TPC-H Query Time
In this section, we report the minimum, maximum, and average execution time of TPC-H Query 6 for both scenarios (Spark compaction and Fusion compaction). This gives a clear view of best-case, worst-case, and steady-state query behavior under continuous CDC and active maintenance.
- Fusion TPCH Timing Details
- Spark TPCH Timing Details
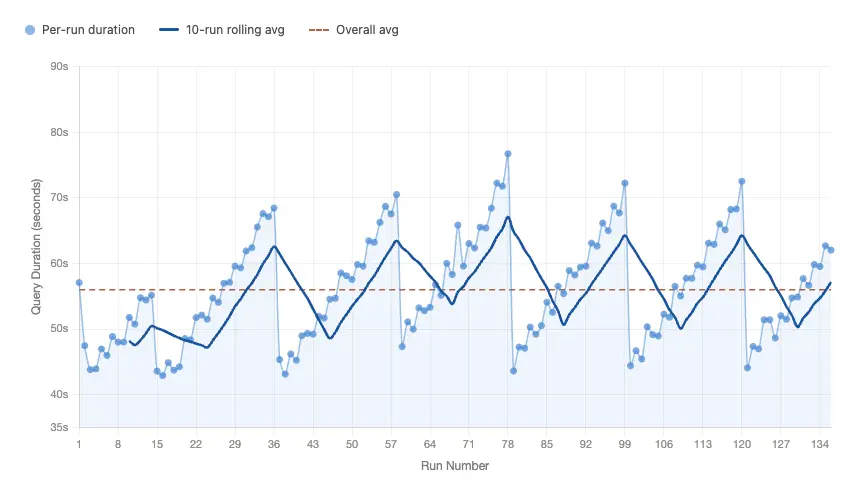
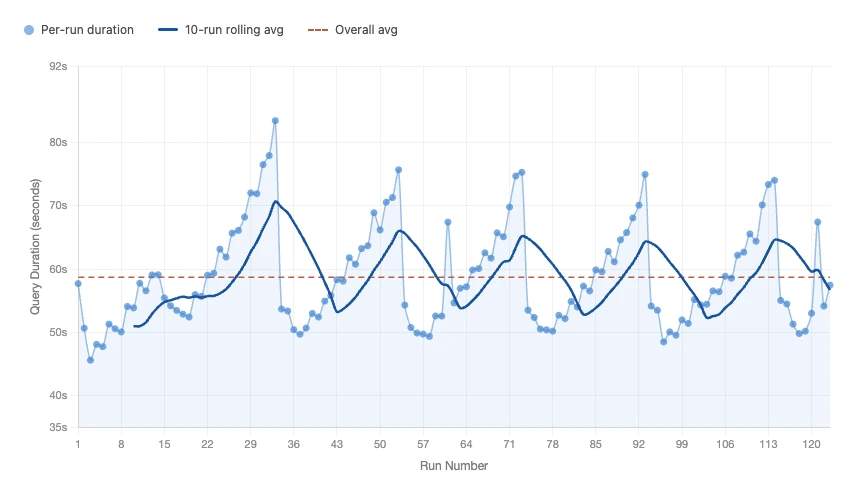
Comparison between Fusion and Spark TPC-H Query 6 execution time:
| Metric | Fusion | Spark |
|---|---|---|
| Average query time | 56.00 s | 58.72 s |
| Min query time | 42.90 s | 45.62 s |
| Max query time | 76.71 s | 83.46 s |
2. Compaction Time
Here we compare how long each compaction approach took to run under the same ingestion and observation window. Use the tabs below for Fusion vs Spark.
- Fusion Compaction Time
- Spark Compaction Time
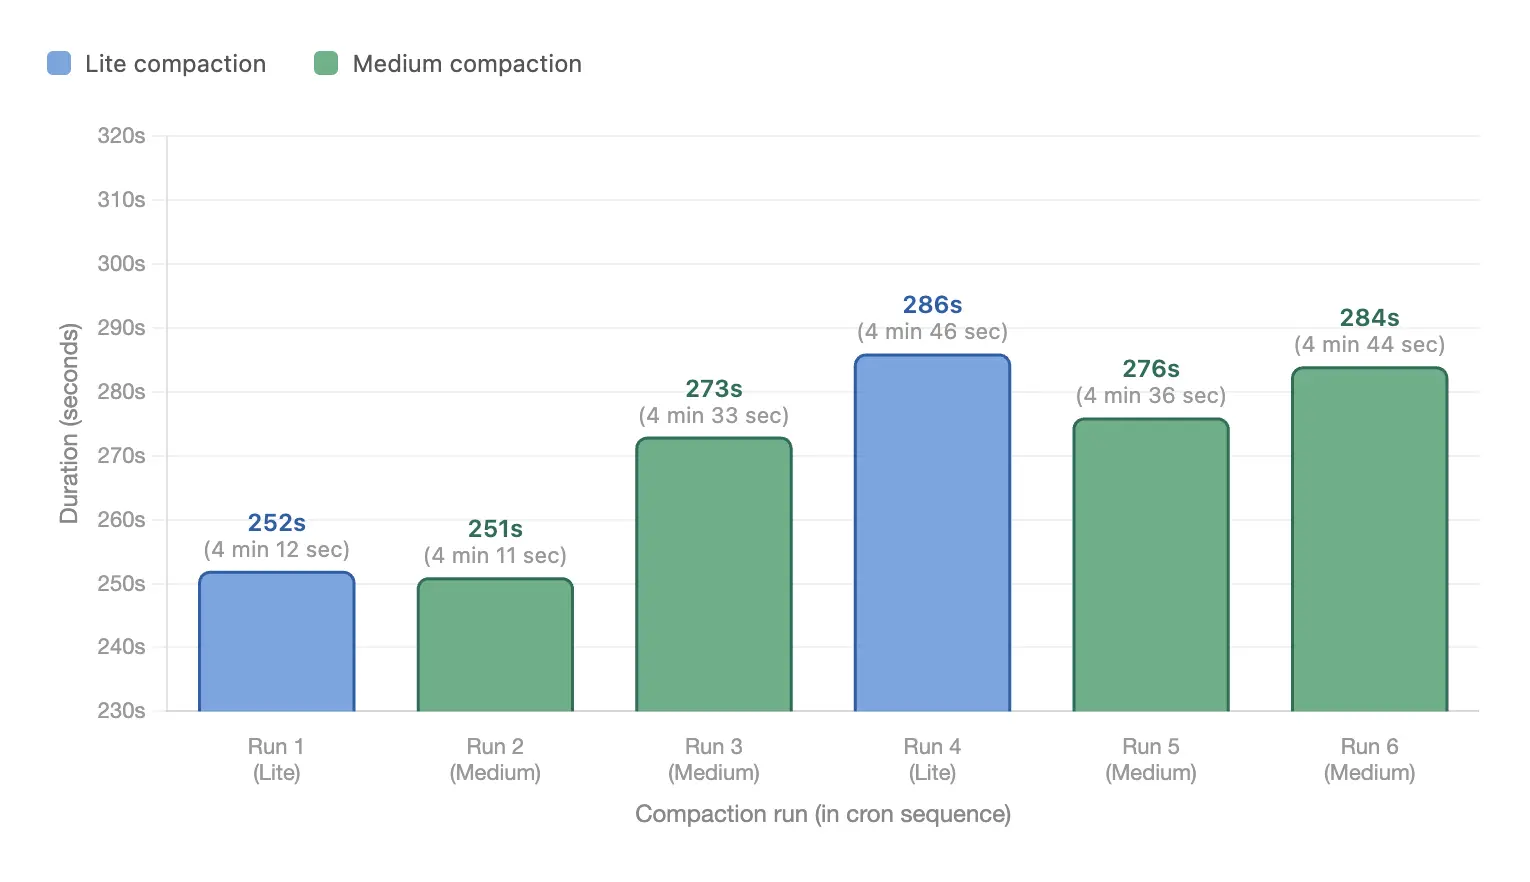
Summary (Fusion):
- Total compaction time: 27 mins 02 secs
- Average per run: 4 mins 30 secs
- Min: 4 mins 11 secs
- Max: 4 mins 46 secs
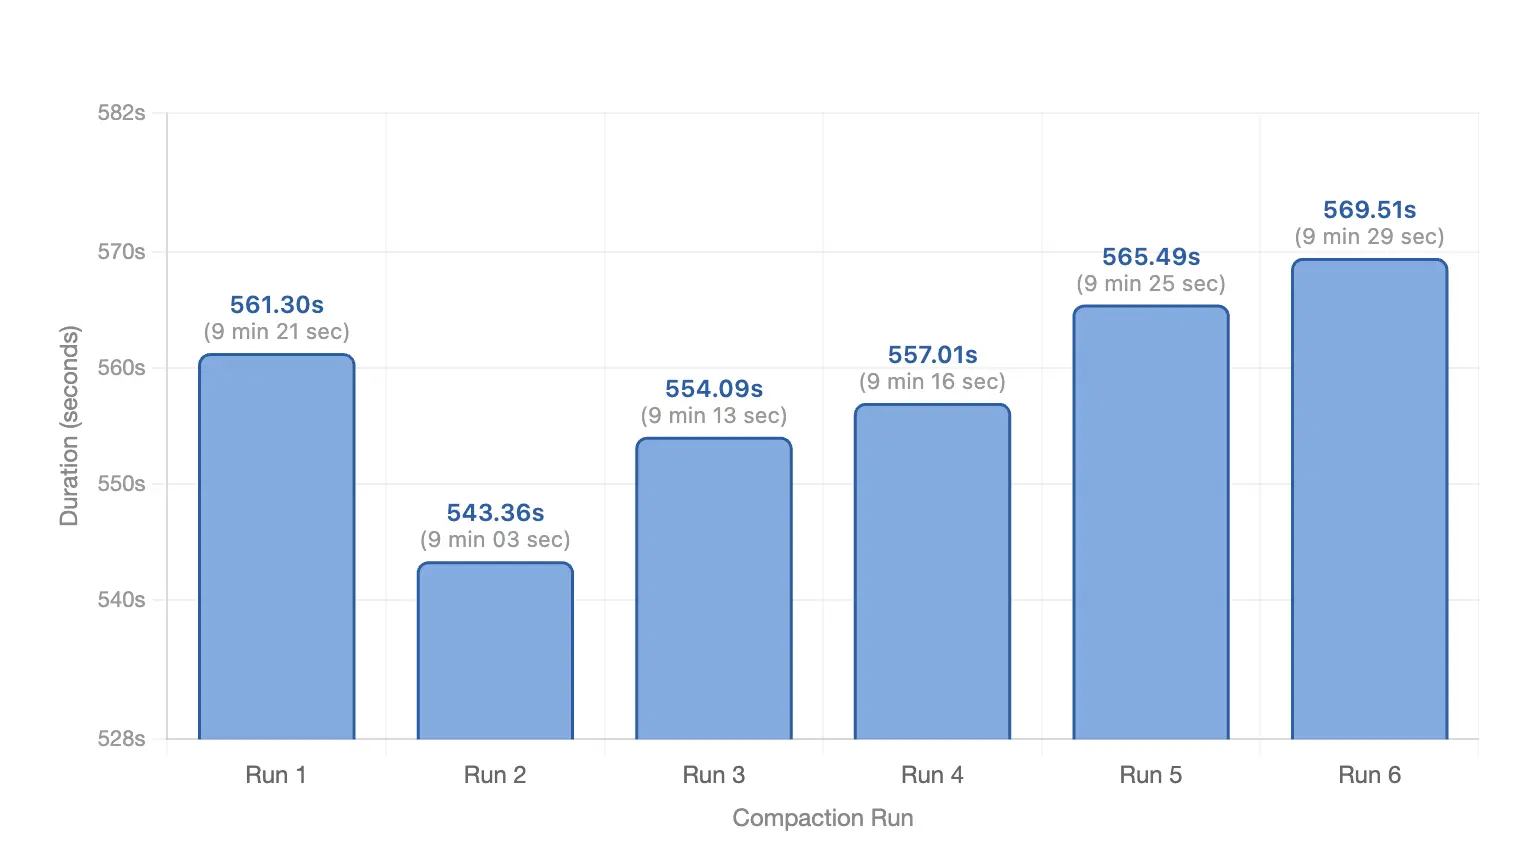
Summary (Spark):
- Total compaction time: 55 mins 47 secs
- Average per run: 9 mins 18 secs
- Min: 9 mins 03 secs
- Max: 9 mins 29 secs
Both Fusion and Spark compaction ran 6 times in this window:
| Run | Fusion | Spark | Conclusion |
|---|---|---|---|
| 1 | 4 mins 12 secs | 9 mins 21 secs | Fusion ~2.2x faster |
| 2 | 4 mins 11 secs | 9 mins 03 secs | Fusion ~2.2x faster |
| 3 | 4 mins 33 secs | 9 mins 13 secs | Fusion ~2.0x faster |
| 4 | 4 mins 46 secs | 9 mins 16 secs | Fusion ~1.9x faster |
| 5 | 4 mins 36 secs | 9 mins 25 secs | Fusion ~2.0x faster |
| 6 | 4 mins 44 secs | 9 mins 29 secs | Fusion ~2.0x faster |
Final compaction-time verdict: In this benchmark, Fusion clearly outperforms Spark. It finishes each compaction cycle in 4 mins 30 secs on average, compared with 9 mins 18 secs for Spark (~2.06x faster). Across the full 6-run window, Fusion takes 27 mins 02 secs, while Spark takes 55 mins 47 secs.
3. Cost
In this section, we compare the compaction cost for Spark and Fusion based on the resources used and the time each compaction workflow took to run. The objective is to show the operational trade-off clearly: not just which approach works, but which one delivers better efficiency per unit of compute spend.
Before calculating total compaction cost, here are the hourly rates for each instance type used in this benchmark:
| Instance type | Disk size | Cost per hour (USD) |
|---|---|---|
c4a-standard-8 | 100 GB | $0.38 |
c4a-highmem-16 | 100 GB | $0.99 |
c4a-standard-32 | 1000 GB | $1.60 |
Using the compaction infrastructure and total compaction durations from this benchmark:
| Engine | Resources included for compaction cost | Hourly infrastructure cost | Total compaction time | Total compaction cost |
|---|---|---|---|---|
| Fusion | c4a-standard-82 x c4a-highmem-16 | $2.36/hour | 27 mins 02 secs | $1.06 |
| Spark | c4a-standard-82 x c4a-highmem-16 | $2.36/hour | 55 mins 47 secs | $2.19 |
Cost Summary
- Fusion total compaction cost: $1.06
- Spark total compaction cost: $2.19
- Difference: Spark costs about $1.13 more in this window
- Relative: Fusion is about 51.6% lower cost (or Spark is about 2.06x more expensive) for compaction in this benchmark
If we project this same 2-hour pattern linearly, the cost gap compounds quickly:
| Period | Fusion cost | Spark cost | Spark extra cost |
|---|---|---|---|
| Daily | $12.72 | $26.28 | $13.56 |
| Weekly | $89.04 | $183.96 | $94.92 |
| Monthly (30 days) | $381.60 | $788.40 | $406.80 |
These are directional projections based on this benchmark window; real production cost will vary with ingestion rate, file growth, and compaction frequency.
Conclusion
Compaction strategy is not a background maintenance detail; it directly impacts query latency, compaction runtime, and infrastructure cost.
Under the same ingestion pressure and comparable infrastructure, Fusion outperformed Spark across core metrics in this benchmark window:
- Query time: ~56s average on Fusion vs ~59s on Spark
- Compaction time: 27m 02s for Fusion vs 55m 47s for Spark (~2.06x faster)
- Cost: $1.06 on Fusion vs $2.19 on Spark (~51.6% lower)
Most important takeaway: It is not necessary to run Full compaction in every cycle. For continuous CDC-heavy workloads, the day-to-day strategy should be Lite and Medium compaction to control file growth with much lower runtime and cost. Full compaction should be treated as a periodic deep-clean operation, triggered less frequently when long-term small-file accumulation demands it.