Iceberg Compaction: How Much Faster Are TPC-H Queries?

There is a very common piece of advice in the Iceberg community: compact your tables regularly, or your query performance will suffer. Most people nod along and accept it as true. But how much does it actually matter? Is it a 10% speedup, or are we talking about an order of magnitude?
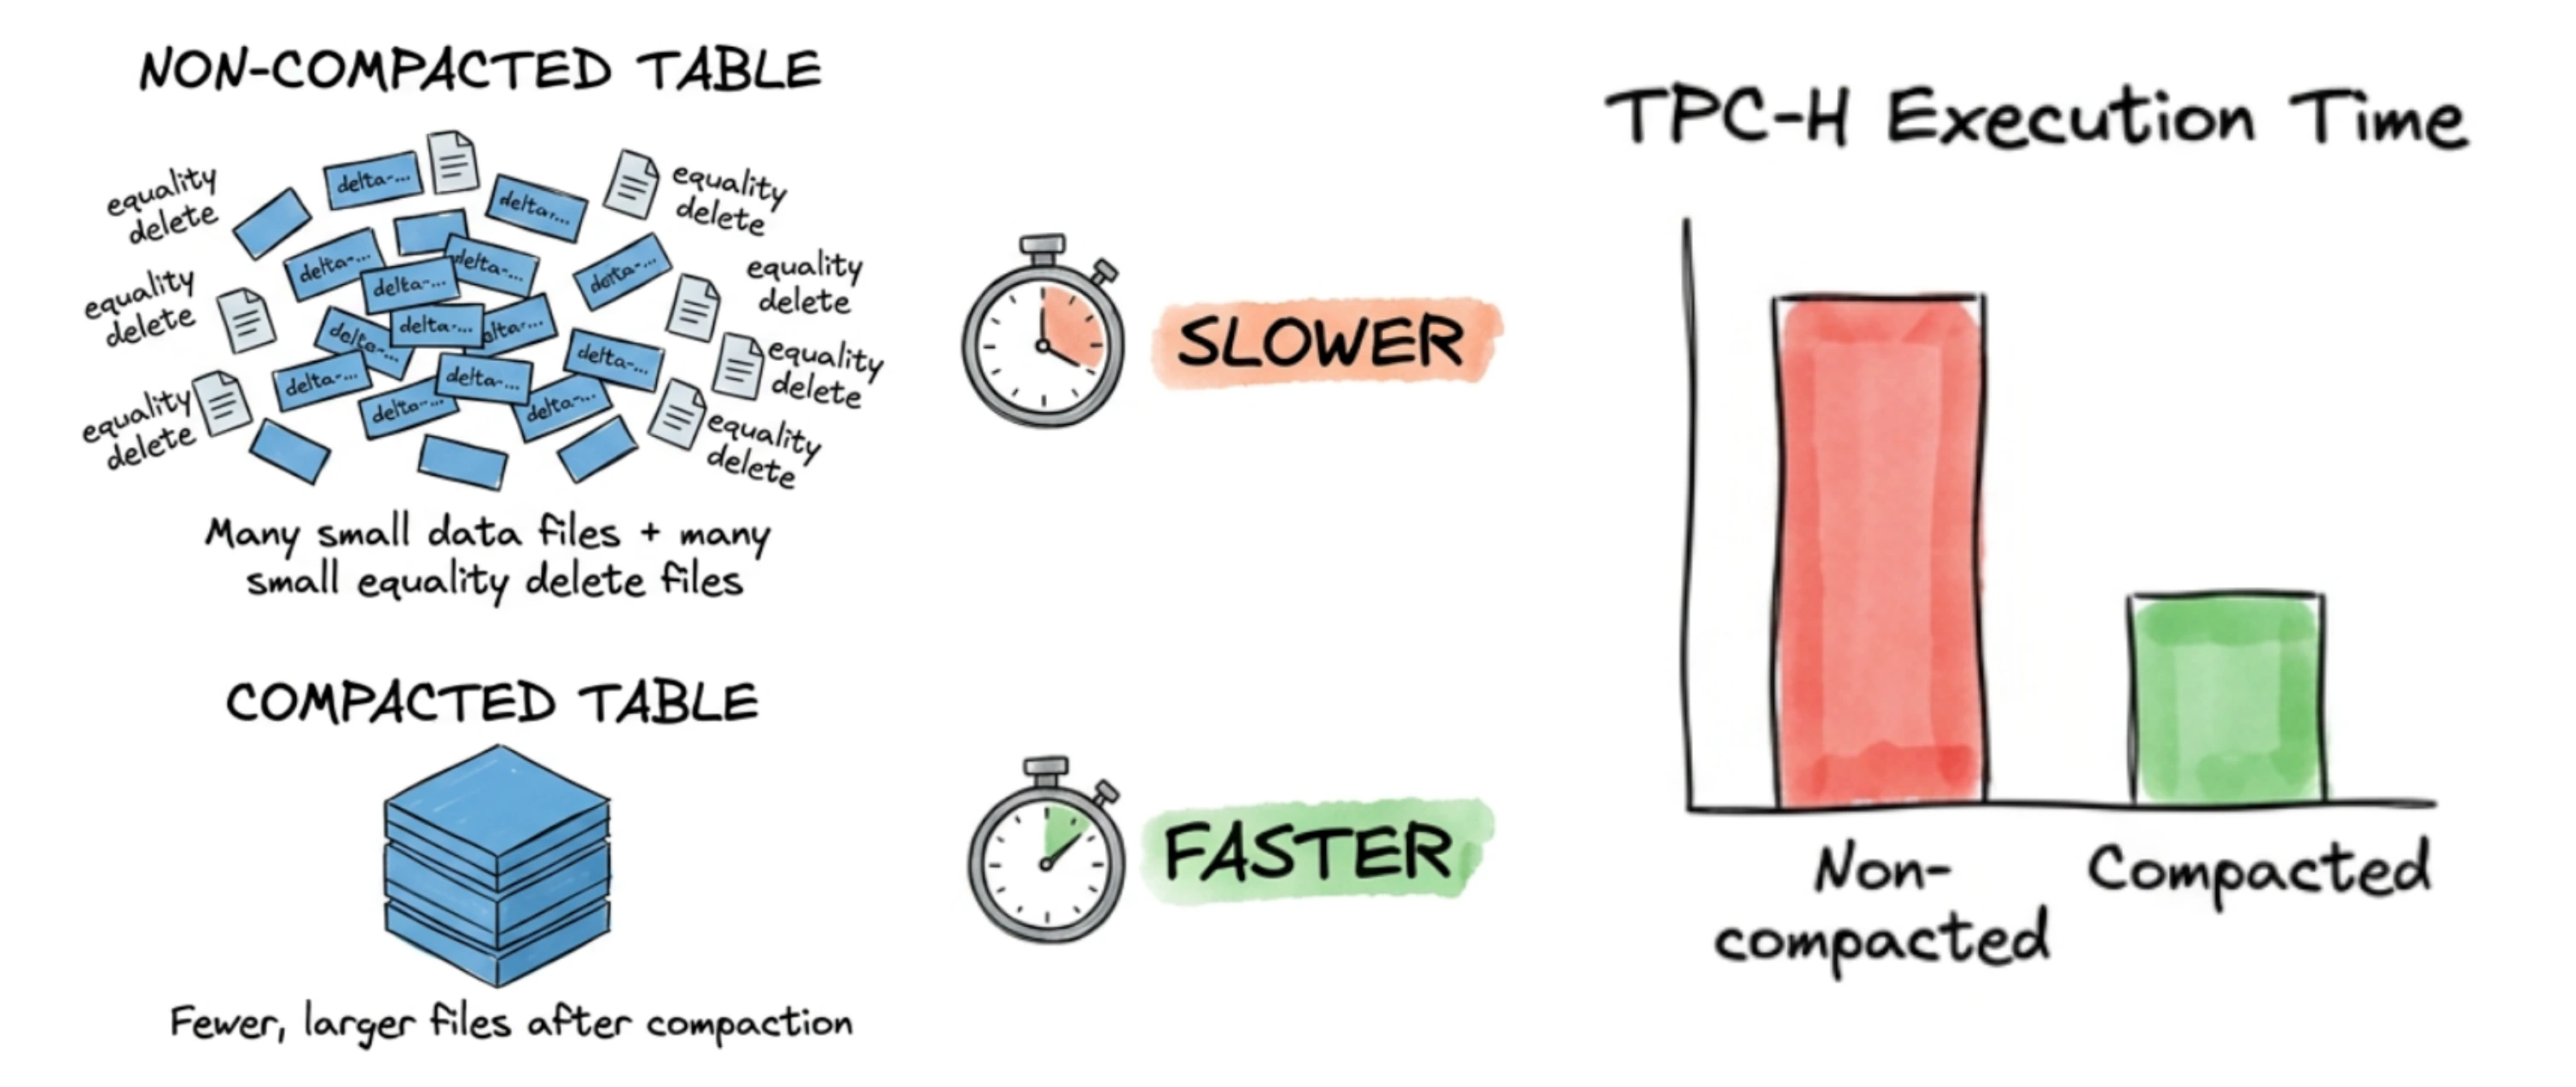
We decided to stop guessing and run a real benchmark. We took 1 TB of TPC-H data, deliberately filled it with thousands of tiny equality delete files to simulate what a real-world CDC-heavy lakehouse looks like after weeks of continuous ingestion — and then ran all 22 TPC-H queries before and after compaction. The numbers told a very clear story.
This blog walks through the entire journey: the ingestion, the deliberate manipulating of our own dataset, the infrastructure battles we fought along the way, and what the benchmark results actually look like.
New to Iceberg compaction? Before going further, we recommend reading our deep-dive on what compaction is and why it matters. This post assumes a basic familiarity with Apache Iceberg's Merge-on-Read (MOR) model and equality delete files. If you're not familiar with the difference between MOR and COW tables, read our guide on Merge-on-Read vs Copy-on-Write.
Getting 1 TB of TPC-H Data into Iceberg
The TPC-H benchmark is a standard set of eight interrelated tables (region, nation, supplier, part, partsupp, orders, lineitem, and customer) designed to simulate a realistic business analytics workload. At scale factor 1000, it produces roughly 1 TB of data.
We used OLake to ingest this data from PostgreSQL directly into Apache Iceberg tables stored in S3, with AWS Glue as the catalog. After the full load completed, we had eight clean Iceberg tables sitting in S3, backed by a Glue catalog, with zero delete files and well-sized Parquet data files. Query performance at this point was healthy.
For those benchmark results—including query times, memory utilization, and a comparison with Databricks—see Running TPC-H queries in our Databricks vs Apache Iceberg blog.
Manufacturing the Small File Problem
Here's where things get interesting. In production, small file accumulation happens gradually — a CDC pipeline runs every few minutes, each run writes a small batch of new data files and equality delete files, and over weeks or months the file count balloons. We wanted to simulate that end state quickly, in a controlled and reproducible way.
Our approach: a custom equality delete generator that would create 1,000 equality delete files per table without changing a single row of data logically. Here's how it worked.
The goal was to create a large number of small equality delete files while keeping the table's logical content identical, so that any query performance difference we observed would be attributable purely to the file structure and not to data differences.
In our run, the table lineitem which is supposed to be the biggest table in TPCH started with 843 data files, almost all around 512 MB each. The script added 1,000 new data files and 1,000 equality delete files, so we ended up with 1,843 data files.
How the Equality Delete Generator Works
The script used a deterministic hash over each table's primary key to pick 2% of rows across 1,000 non-overlapping batches. It scanned only the primary key columns for efficiency, wrote one small Parquet equality delete file per batch via Iceberg's native writer, then reinserted those same rows from the original snapshot. Net effect: zero data change logically — we deleted rows and added them back — but physically each table now had 1,000 equality delete files and 1,000 extra data files from the reinserts, which the merge-on-read engine must process at query time.
View the equality delete generator script
package com.olake.tpch;
import org.apache.iceberg.DeleteFile;
import org.apache.iceberg.Schema;
import org.apache.iceberg.Snapshot;
import org.apache.iceberg.Table;
import org.apache.iceberg.aws.glue.GlueCatalog;
import org.apache.iceberg.catalog.Namespace;
import org.apache.iceberg.catalog.TableIdentifier;
import org.apache.iceberg.data.GenericRecord;
import org.apache.iceberg.data.Record;
import org.apache.iceberg.deletes.EqualityDeleteWriter;
import org.apache.iceberg.io.OutputFile;
import org.apache.iceberg.data.parquet.GenericParquetWriter;
import org.apache.iceberg.parquet.Parquet;
import org.apache.iceberg.types.Types;
import org.apache.spark.sql.Row;
import org.apache.spark.sql.SparkSession;
import java.io.IOException;
import java.time.Instant;
import java.time.LocalDateTime;
import java.time.ZoneId;
import java.time.format.DateTimeFormatter;
import java.util.ArrayList;
import java.util.Arrays;
import java.util.Collections;
import java.util.HashMap;
import java.util.LinkedHashMap;
import java.util.List;
import java.util.Map;
import java.util.UUID;
import java.util.stream.Collectors;
/**
* Generates Iceberg V2 equality delete files for TPCH tables.
*
* v2 — Multi-batch optimisation:
* Groups N consecutive batches (default 50) into one "group".
* Each group performs:
* 1. ONE full-table scan (reading from the original snapshot via time-travel)
* to collect primary-key rows for all batches in the group.
* 2. Writes N separate equality delete files, one per batch, and commits each.
* 3. ONE combined re-insertion from the original snapshot so logical data
* is unchanged.
*
* Supports --start-batch to resume from a specific batch (1-indexed, matches
* the "batch N/1000" numbering in logs).
*
* End result: table data is logically identical, but the table now contains
* ~{num-batches} equality delete files, which degrade read performance
* until compaction is run.
*
* SAFETY: Before processing each table the script logs the current snapshot ID.
* If anything goes wrong you can roll back using:
* CALL catalog.system.rollback_to_snapshot('db.table', snapshot_id);
*/
public class EqualityDeleteGenerator {
private static final DateTimeFormatter TS_FMT =
DateTimeFormatter.ofPattern("yyyy-MM-dd HH:mm:ss");
// ── TPCH primary keys ──────────────────────────────────────────────
private static final Map<String, List<String>> TABLE_KEYS = new LinkedHashMap<>();
static {
TABLE_KEYS.put("lineitem", Arrays.asList("l_orderkey", "l_linenumber"));
TABLE_KEYS.put("orders", Collections.singletonList("o_orderkey"));
TABLE_KEYS.put("customer", Collections.singletonList("c_custkey"));
TABLE_KEYS.put("part", Collections.singletonList("p_partkey"));
TABLE_KEYS.put("supplier", Collections.singletonList("s_suppkey"));
TABLE_KEYS.put("partsupp", Arrays.asList("ps_partkey", "ps_suppkey"));
TABLE_KEYS.put("nation", Collections.singletonList("n_nationkey"));
TABLE_KEYS.put("region", Collections.singletonList("r_regionkey"));
}
// ── Entry point ────────────────────────────────────────────────────
public static void main(String[] args) {
String catalogName = getArg(args, "--catalog", "olake_iceberg");
String database = getArg(args, "--database", "postgres_postgres_tpch");
String tablesArg = getArg(args, "--tables",
"lineitem,orders,customer,part,supplier,partsupp,nation,region");
int numBatches = Integer.parseInt(
getArg(args, "--num-batches", "1000"));
double deletePct = Double.parseDouble(
getArg(args, "--delete-percent", "2.0"));
boolean continueErr = hasFlag(args, "--continue-on-error");
int batchesPerGroup = Integer.parseInt(
getArg(args, "--batches-per-group", "50"));
String startBatchArg = getArg(args, "--start-batch", "");
// Parse --start-batch "lineitem=10,orders=5"
// Values are 1-indexed (matches "batch N/1000" in logs)
Map<String, Integer> startBatchMap = new HashMap<>();
if (startBatchArg != null && !startBatchArg.isEmpty()) {
for (String entry : startBatchArg.split(",")) {
String[] kv = entry.split("=");
if (kv.length == 2) {
startBatchMap.put(kv[0].trim(),
Integer.parseInt(kv[1].trim()));
}
}
}
if (database == null) {
System.err.println("ERROR: --database is required");
System.exit(1);
}
List<String> tableNames = Arrays.stream(tablesArg.split(","))
.map(String::trim)
.filter(s -> !s.isEmpty())
.collect(Collectors.toList());
SparkSession spark = SparkSession.builder()
.appName("EqualityDeleteGenerator")
.getOrCreate();
GlueCatalog catalog = initGlueCatalog(spark, catalogName);
log("════════════════════════════════════════════════════");
log(" Iceberg Equality Delete File Generator (v2 – multi-batch)");
log("════════════════════════════════════════════════════");
log("Catalog: " + catalogName);
log("Database: " + database);
log("Tables: " + tableNames);
log("Num batches: " + numBatches);
log("Delete percent: " + deletePct + "%");
log("Batches per group: " + batchesPerGroup);
log("Start-batch map: " + (startBatchMap.isEmpty() ? "(all from 1)" : startBatchMap));
log("Continue on err: " + continueErr);
log("════════════════════════════════════════════════════");
List<String> failures = new ArrayList<>();
List<String> summaries = new ArrayList<>();
long globalStart = System.currentTimeMillis();
for (int tIdx = 0; tIdx < tableNames.size(); tIdx++) {
String tableName = tableNames.get(tIdx);
// 1-indexed start batch (default 1 = from the beginning)
int startBatch1Idx = startBatchMap.getOrDefault(tableName, 1);
int startBatchIdx = startBatch1Idx - 1; // convert to 0-indexed
log("");
log("────────────────────────────────────────────────────");
log(String.format(" TABLE %d/%d : %s (start batch: %d)",
tIdx + 1, tableNames.size(), tableName, startBatch1Idx));
log("────────────────────────────────────────────────────");
try {
String summary = processTable(spark, catalog, catalogName,
database, tableName, numBatches, deletePct,
startBatchIdx, batchesPerGroup);
summaries.add(summary);
} catch (Exception e) {
String msg = "[" + tableName + "] FAILED: " + e.getMessage();
logError(msg);
e.printStackTrace();
failures.add(msg);
summaries.add(String.format("[%s] FAILED — %s",
tableName, e.getMessage()));
if (!continueErr) break;
}
}
try { catalog.close(); } catch (Exception ignored) { }
long globalSecs = (System.currentTimeMillis() - globalStart) / 1000;
// ── Final summary ──
log("");
log("════════════════════════════════════════════════════");
log(" FINAL SUMMARY (total time: " + formatDuration(globalSecs) + ")");
log("════════════════════════════════════════════════════");
for (String s : summaries) {
log(" " + s);
}
log("════════════════════════════════════════════════════");
if (!failures.isEmpty()) {
logError("FAILURES (" + failures.size() + "):");
failures.forEach(f -> logError(" ✗ " + f));
System.exit(2);
}
log("ALL TABLES COMPLETED SUCCESSFULLY");
}
// ── Catalog bootstrap ──────────────────────────────────────────────
private static GlueCatalog initGlueCatalog(SparkSession spark,
String catalogName) {
String prefix = "spark.sql.catalog." + catalogName + ".";
Map<String, String> props = new HashMap<>();
for (scala.Tuple2<String, String> kv :
spark.sparkContext().getConf().getAll()) {
if (kv._1().startsWith(prefix)) {
String key = kv._1().substring(prefix.length());
if (!key.isEmpty()) {
props.put(key, kv._2());
}
}
}
props.remove("catalog-impl");
log("Initializing GlueCatalog with properties: " + props);
GlueCatalog catalog = new GlueCatalog();
catalog.setConf(spark.sparkContext().hadoopConfiguration());
catalog.initialize(catalogName, props);
log("GlueCatalog initialized successfully.");
return catalog;
}
// ── Per-table processing (multi-batch groups) ─────────────────────
private static String processTable(SparkSession spark,
GlueCatalog catalog,
String catalogName,
String database,
String tableName,
int numBatches,
double deletePct,
int startBatch,
int batchesPerGroup) throws IOException {
List<String> keyColumns = TABLE_KEYS.get(tableName);
if (keyColumns == null) {
log("[" + tableName + "] No key columns defined — skipping.");
return String.format("[%s] SKIPPED — no key columns defined", tableName);
}
String fullSparkName = catalogName + "." + database + "." + tableName;
TableIdentifier tableId =
TableIdentifier.of(Namespace.of(database), tableName);
Table table = catalog.loadTable(tableId);
// ── Capture original snapshot — used for ALL reads ──
// Reading from this fixed snapshot avoids the overhead of applying
// accumulated delete files during key-collection and reinsertion scans.
table.refresh();
Snapshot currentSnap = table.currentSnapshot();
long originalSnapId = -1;
if (currentSnap != null) {
originalSnapId = currentSnap.snapshotId();
String snapTime = Instant.ofEpochMilli(currentSnap.timestampMillis())
.atZone(ZoneId.systemDefault()).format(TS_FMT);
log(String.format(
"[%s] *** ROLLBACK POINT *** snapshot_id = %d (taken at %s)",
tableName, originalSnapId, snapTime));
log(String.format(
"[%s] To undo all changes: CALL %s.system.rollback_to_snapshot"
+ "('%s.%s', %d);",
tableName, catalogName, database, tableName, originalSnapId));
} else {
log("[" + tableName + "] WARNING: table has no snapshots yet.");
}
// ── Row count (from current snapshot) ──
long totalRows = spark.sql("SELECT count(*) FROM " + fullSparkName)
.first().getLong(0);
log(String.format("[%s] Total rows: %,d", tableName, totalRows));
if (totalRows == 0) {
log("[" + tableName + "] Empty — skipping.");
return String.format("[%s] SKIPPED — empty table", tableName);
}
// ── Modulo base (handle small tables) ──
long standardModulo = Math.round(numBatches / (deletePct / 100.0));
long moduloBase;
if (totalRows < standardModulo) {
moduloBase = numBatches;
log(String.format(
"[%s] Small table (%,d rows) — modulo=%d (covers all rows)",
tableName, totalRows, numBatches));
} else {
moduloBase = standardModulo;
long expectedDeletes = Math.round(totalRows * deletePct / 100.0);
long perBatch = expectedDeletes / numBatches;
log(String.format(
"[%s] Target: ~%,d rows (%.1f%%), ~%,d rows/batch, modulo=%,d",
tableName, expectedDeletes, deletePct, perBatch, moduloBase));
}
// ── Iceberg schema info ──
Schema iceSchema = table.schema();
int[] eqFieldIds = keyColumns.stream()
.mapToInt(c -> iceSchema.findField(c).fieldId())
.toArray();
Schema deleteSchema = iceSchema.select(keyColumns);
// ── Hash expression for Spark SQL ──
String keyColsJoined = String.join(", ", keyColumns);
String hashExpr = "pmod(hash(" + keyColsJoined + "), " + moduloBase + ")";
int totalGroups = (int) Math.ceil(
(numBatches - startBatch) / (double) batchesPerGroup);
log(String.format(
"[%s] Config: startBatch=%d batchesPerGroup=%d totalGroups=%d",
tableName, startBatch + 1, batchesPerGroup, totalGroups));
log(String.format("[%s] Hash expression: %s", tableName, hashExpr));
log(String.format("[%s] Original snapshot for reads: %d",
tableName, originalSnapId));
log(String.format("[%s] Table location: %s", tableName, table.location()));
log(String.format("[%s] Starting group loop...", tableName));
long totalDeletedRows = 0;
int deleteFilesCreated = 0;
int emptyBatches = 0;
long tableStartMs = System.currentTimeMillis();
int groupNum = 0;
for (int groupStart = startBatch;
groupStart < numBatches;
groupStart += batchesPerGroup) {
int groupEnd = Math.min(groupStart + batchesPerGroup, numBatches);
int groupSize = groupEnd - groupStart;
groupNum++;
long groupStartMs = System.currentTimeMillis();
log("");
log(String.format(
"[%s] ── GROUP %d/%d (batches %d–%d, %d batches) ──",
tableName, groupNum, totalGroups,
groupStart + 1, groupEnd, groupSize));
// WHERE clause — consecutive batch range
String groupWhere;
if (groupSize == 1) {
groupWhere = hashExpr + " = " + groupStart;
} else {
groupWhere = hashExpr + " >= " + groupStart
+ " AND " + hashExpr + " < " + groupEnd;
}
// ════════════════════════════════════════════════════
// STEP 1: ONE scan of the original snapshot to collect all keys
// ════════════════════════════════════════════════════
String collectSql = String.format(
"SELECT %s, %s AS __batch_num FROM %s VERSION AS OF %d WHERE %s",
keyColsJoined, hashExpr, fullSparkName,
originalSnapId, groupWhere);
log(String.format(
"[%s] Step 1/3: Collecting keys for %d batches "
+ "from snap %d ...",
tableName, groupSize, originalSnapId));
long t1 = System.currentTimeMillis();
List<Row> allKeyRows = spark.sql(collectSql).collectAsList();
long collectSecs = (System.currentTimeMillis() - t1) / 1000;
log(String.format("[%s] Collected %,d key rows in %s",
tableName, allKeyRows.size(), formatDuration(collectSecs)));
if (allKeyRows.isEmpty()) {
emptyBatches += groupSize;
log(String.format("[%s] Group entirely empty — skipping",
tableName));
continue;
}
// Partition rows by batch number
Map<Integer, List<Row>> batchToKeys = new HashMap<>();
for (Row row : allKeyRows) {
Object batchVal = row.get(row.size() - 1); // __batch_num
int batchNum = ((Number) batchVal).intValue();
batchToKeys.computeIfAbsent(batchNum, k -> new ArrayList<>())
.add(row);
}
allKeyRows = null; // free memory
// ════════════════════════════════════════════════════
// STEP 2: Write separate equality delete files + commit each
// ════════════════════════════════════════════════════
log(String.format(
"[%s] Step 2/3: Writing %d equality delete files ...",
tableName, batchToKeys.size()));
long t2 = System.currentTimeMillis();
int groupDeletedRows = 0;
int groupFiles = 0;
for (int batch = groupStart; batch < groupEnd; batch++) {
List<Row> keyRows =
batchToKeys.getOrDefault(batch, Collections.emptyList());
if (keyRows.isEmpty()) {
emptyBatches++;
continue;
}
String delPath = table.location() + "/data/eq-del-" + tableName
+ "-b" + String.format("%04d", batch)
+ "-" + UUID.randomUUID().toString() + ".parquet";
OutputFile outFile = table.io().newOutputFile(delPath);
EqualityDeleteWriter<Record> writer =
Parquet.writeDeletes(outFile)
.forTable(table)
.rowSchema(deleteSchema)
.createWriterFunc(msgType ->
GenericParquetWriter.create(deleteSchema, msgType))
.equalityFieldIds(eqFieldIds)
.buildEqualityWriter();
for (Row row : keyRows) {
GenericRecord rec = GenericRecord.create(deleteSchema);
for (int col = 0; col < keyColumns.size(); col++) {
rec.set(col, coerceType(
row.get(col),
deleteSchema.columns().get(col).type()));
}
writer.write(rec);
}
writer.close();
DeleteFile deleteFile = writer.toDeleteFile();
table.newRowDelta()
.addDeletes(deleteFile)
.commit();
table.refresh();
totalDeletedRows += keyRows.size();
deleteFilesCreated++;
groupDeletedRows += keyRows.size();
groupFiles++;
// Short per-batch log
String fileName =
delPath.substring(delPath.lastIndexOf('/') + 1);
log(String.format(
"[%s] batch %d/%d — %,d rows → %s",
tableName, batch + 1, numBatches,
keyRows.size(), fileName));
}
long writeSecs = (System.currentTimeMillis() - t2) / 1000;
log(String.format(
"[%s] Wrote %d delete files (%,d rows) in %s",
tableName, groupFiles, groupDeletedRows,
formatDuration(writeSecs)));
batchToKeys = null; // free memory
// ════════════════════════════════════════════════════
// STEP 3: ONE combined reinsertion from the original snapshot
// ════════════════════════════════════════════════════
log(String.format(
"[%s] Step 3/3: Reinserting %,d rows from original "
+ "snapshot %d ...",
tableName, groupDeletedRows, originalSnapId));
long t3 = System.currentTimeMillis();
spark.sql("REFRESH TABLE " + fullSparkName);
spark.sql(String.format(
"INSERT INTO %s SELECT * FROM %s VERSION AS OF %d WHERE %s",
fullSparkName, fullSparkName, originalSnapId, groupWhere));
long reinsertSecs = (System.currentTimeMillis() - t3) / 1000;
log(String.format("[%s] Reinsertion complete in %s",
tableName, formatDuration(reinsertSecs)));
// ── Group summary ──
long groupSecs = (System.currentTimeMillis() - groupStartMs) / 1000;
double pctDone = (groupEnd * 100.0) / numBatches;
double pctDeleted = (totalDeletedRows * 100.0) / totalRows;
long elapsedSecs = (System.currentTimeMillis() - tableStartMs) / 1000;
// ETA
double batchesDone = groupEnd - startBatch;
double batchesLeft = numBatches - groupEnd;
long etaSecs = (batchesDone > 0)
? Math.round(elapsedSecs * batchesLeft / batchesDone) : 0;
log(String.format(
"[%s] GROUP %d/%d ✓ files=%d rows=%,d "
+ "collect=%s write=%s reinsert=%s total=%s",
tableName, groupNum, totalGroups,
groupFiles, groupDeletedRows,
formatDuration(collectSecs), formatDuration(writeSecs),
formatDuration(reinsertSecs), formatDuration(groupSecs)));
log(String.format(
"[%s] Cumulative: %,d files, %,d rows (%.2f%%) "
+ "progress=%.1f%% elapsed=%s ETA=%s",
tableName, deleteFilesCreated, totalDeletedRows, pctDeleted,
pctDone, formatDuration(elapsedSecs),
formatDuration(etaSecs)));
// Milestone every 100 batches or at the end
if (groupEnd % 100 == 0 || groupEnd == numBatches) {
log(String.format(
"[%s] ──── MILESTONE: %d/%d batches "
+ "(%,d files, %,d rows, %.2f%%) ────",
tableName, groupEnd, numBatches,
deleteFilesCreated, totalDeletedRows, pctDeleted));
}
}
long tableSecs = (System.currentTimeMillis() - tableStartMs) / 1000;
double actualPct = (totalDeletedRows * 100.0) / totalRows;
log("");
log(String.format("[%s] ════════ TABLE COMPLETE ════════", tableName));
log(String.format("[%s] Total rows in table: %,d",
tableName, totalRows));
log(String.format("[%s] Equality-deleted rows: %,d (%.2f%%)",
tableName, totalDeletedRows, actualPct));
log(String.format("[%s] Delete files created: %d",
tableName, deleteFilesCreated));
log(String.format("[%s] Empty batches skipped: %d",
tableName, emptyBatches));
log(String.format("[%s] Total time: %s",
tableName, formatDuration(tableSecs)));
if (originalSnapId >= 0) {
log(String.format("[%s] Rollback snapshot ID: %d",
tableName, originalSnapId));
}
log(String.format("[%s] ════════════════════════════════", tableName));
return String.format("[%s] %,d delete files, %,d rows (%.2f%%), %s",
tableName, deleteFilesCreated, totalDeletedRows, actualPct,
formatDuration(tableSecs));
}
// ── Helpers ────────────────────────────────────────────────────────
private static Object coerceType(Object value,
org.apache.iceberg.types.Type iceType) {
if (value == null) return null;
if (iceType instanceof Types.IntegerType && value instanceof Long) {
return ((Long) value).intValue();
}
if (iceType instanceof Types.LongType && value instanceof Integer) {
return ((Integer) value).longValue();
}
return value;
}
private static void log(String message) {
String ts = LocalDateTime.now().format(TS_FMT);
System.out.println("[" + ts + "] " + message);
}
private static void logError(String message) {
String ts = LocalDateTime.now().format(TS_FMT);
System.err.println("[" + ts + "] ERROR: " + message);
}
private static String formatDuration(long totalSeconds) {
if (totalSeconds < 60) return totalSeconds + "s";
long hours = totalSeconds / 3600;
long mins = (totalSeconds % 3600) / 60;
long secs = totalSeconds % 60;
if (hours > 0) return String.format("%dh %dm %ds", hours, mins, secs);
return String.format("%dm %ds", mins, secs);
}
private static String getArg(String[] args, String key, String def) {
for (int i = 0; i < args.length - 1; i++) {
if (args[i].equals(key)) return args[i + 1];
}
return def;
}
private static boolean hasFlag(String[] args, String flag) {
for (String a : args) {
if (a.equals(flag)) return true;
}
return false;
}
}
Running TPC-H Queries on a Fragmented Table
With the small-file sabotage complete, we set up our EMR cluster and ran all 22 TPC-H queries. What followed was a series of painful infrastructure lessons before we got clean results.
- Final setup: Increased EBS size
- Upgraded setup: 128 GB workers (FAILED)
- Initial setup: 64 GB workers (FAILED)
| Node role | Instance type | vCPUs | RAM | EBS Volume Size |
|---|---|---|---|---|
| Master | m6g.8xlarge | 32 | 128 GB | 256 GB |
| Worker (1–10 on demand) | r6g.4xlarge | 16 | 128 GB | 256 GB |
Because we were hitting disk spill issues, we bumped the EBS volume to 256 GB per node, hoping everything would run smoothly. It mostly did — except for one final issue that surfaced further down the track.
Problem: S3 Port Exhaustion on Query 13
With the disk issue resolved, we ran the full 22-query suite again. Twenty-one queries completed. Query 13 failed every time with Unable to execute HTTP request: Cannot assign requested address (SDK Attempt Count: 1) error.
This means the JVM tried to open a new TCP socket to connect to S3, and the operating system refused because all available ephemeral ports on the instance were already in use. TPCH Query 13 performs an outer join between customer and orders table, which in a fragmented table triggers a very large number of concurrent S3 GET requests as Iceberg resolves equality deletes across many small files simultaneously. The sheer volume of concurrent S3 connections exhausted the OS-level port range.
Resolution: We did not attempt to work around this in the pre-compaction run. Query 13's failure was logged as-is and carried forward as a benchmark data point. We expected compaction to resolve it by collapsing the 1,000 delete files into a handful of merged data files, dramatically reducing the S3 connection count during that scan.
| Node role | Instance type | vCPUs | RAM | EBS Volume Size |
|---|---|---|---|---|
| Master | m6g.8xlarge | 32 | 128 GB | 64 GB |
| Worker (1–3 on demand) | r6g.4xlarge | 16 | 128 GB | 64 GB |
With 128 GB workers, the executor OOM crashes stopped entirely. Queries began running end-to-end for the first time. We worked through the TPC-H suite and most queries completed — but two new failure modes appeared that we hadn't seen before, because the jobs hadn't been getting far enough to hit them.
Problem: Disk Overflow on Query 7
It joins supplier, lineitem, orders, customer, nation, and part — one of the largest multi-table joins in the TPC-H suite. At 1 TB scale with a fragmented table, this query generates an enormous amount of intermediate shuffle data.
Spark's behaviour when shuffle data doesn't fit in memory is to spill it to local disk. This is completely normal and expected — Spark is designed to handle data that exceeds memory by spilling gracefully. The problem was what happened after the spill started.
Our EMR cluster's EBS volume was provisioned at the default size: 27 GB. That's a reasonable default for a cluster that's mostly doing in-memory processing, but it is nowhere near sufficient as a spill target for a shuffle stage operating on a 1 TB fragmented dataset. The spill directory filled up almost immediately, and the task failed with a disk-full error java.io.IOException: No space left on device.
The compounding factor here is again the small file problem. A compacted table produces less shuffle data because Iceberg can apply more aggressive partition pruning and projection pushdown when reading well-structured files. Our fragmented table forced Spark to read more raw data per query (since delete file application happens at scan time, after data has already been fetched from S3), which directly inflated the size of intermediate shuffle stages.
We started with what felt like a well-sized EMR cluster for a 1 TB workload:
| Node role | Instance type | vCPUs | RAM | EBS Volume Size |
|---|---|---|---|---|
| Master | m6g.8xlarge | 32 | 128 GB | 64 GB |
| Worker (1–3 on demand) | m6g.4xlarge | 16 | 64 GB | 64 GB |
The cluster used dynamic scaling — it could grow from 1 to 3 worker nodes based on work load, giving us between 16 and 48 worker vCPUs and between 64 GB and 192 GB worker memory at peak. On paper, this should be more than sufficient to run TPC-H at 1 TB scale.
In practice, we never got past the first few heavy queries without executors crashing.
Problem: Executor Out-of-Memory (OOM) Crashes
Every query that involved large joins or multi-stage shuffles — which in TPC-H is most of them — would eventually kill one or more executors with an out-of-memory error. In the worst cases, the repeated executor failures cascaded and the whole worker node went down.
At first this looked like a straightforward tuning problem. We systematically went through every relevant Spark memory configuration:
Attempt 1 — Increase shuffle partitions.
The theory was that fewer rows per partition would mean smaller in-memory sort buffers during shuffles. We increased spark.sql.shuffle.partitions from the default 200 up through 400, 800, and finally 1600. Queries that previously OOM'd at 200 partitions sometimes ran further before failing, but the failures didn't go away — they just moved to a different stage of the same query.
Attempt 2 — Rebalance execution vs storage memory.
Spark's unified memory model splits executor heap between execution memory (used for joins, sorts, aggregations) and storage memory (used for caching). By default, 60% of heap goes to the unified pool and execution can borrow from storage. We tuned spark.memory.fraction up to 0.8 and pushed spark.memory.storageFraction down to 0.2, effectively giving execution memory as much room as possible. It made no meaningful difference — the OOM was happening in execution memory during large hash joins, not because storage was eating into it.
Attempt 3 — Reshape the executor topology. We tried two extremes: many small executors (more instances with 1–2 cores each, less memory per executor) and fewer large executors (fewer instances with 4+ cores each, more memory each). The idea with small executors was to reduce the blast radius when one OOM'd — only that one executor dies, not a whole node's worth of work. The idea with large executors was to give each join stage a single large contiguous memory space to work in. Neither approach solved the problem because the root cause wasn't executor topology.
Attempt 4 — Increase off-heap and overhead allocation.
Some OOMs happen outside the JVM — in native memory used by Parquet/Arrow readers and shuffle buffers. We increased spark.executor.memoryOverhead so that during shuffles there would be more off-heap memory available, reducing those failures. But it's a tradeoff: overhead and execution heap share the same container. At 20GB and 25GB overhead, we still saw problems — the extra overhead came at the expense of execution memory, so Spark had less room for joins and shuffles.
After exhausting all of these approaches without a stable run, we stepped back and thought about what was actually different about this workload compared to a typical 1 TB Spark job.
The answer was the equality delete files. In a normal Iceberg table, a read task opens a data file and scans it. In our fragmented table, every read task first had to load and apply up to 1,000 equality delete files before it could start scanning data. Each equality delete file is a Parquet file that gets read into memory as a hash set of primary keys — and Iceberg keeps these hash sets resident in memory throughout the scan so it can filter out deleted rows as it reads. For a table like lineitem with hundreds of millions of rows spread across thousands of partitions, this meant hundreds of delete-file hash sets living in executor memory simultaneously, all competing with the actual join and aggregation buffers.
This is a form of memory pressure that no amount of Spark tuning can fully compensate for when the underlying hardware is undersized. The 64 GB workers simply did not have enough room for both the delete-file hash sets and the join intermediates of complex multi-table TPC-H queries.
View the TPC-H queries Python script
import time
import logging
import argparse
import os
from pyspark.sql import SparkSession
from typing import Optional, Union, List, Dict, Any

# Logging
logging.basicConfig(level=logging.INFO, format="%(asctime)s - %(levelname)s - %(message)s")
logger = logging.getLogger("tpch_iceberg_benchmark")

def build_spark_session(app_name: str, catalog: str, warehouse: Optional[str], region: Optional[str]) -> SparkSession:
    builder = (
        SparkSession.builder
        .appName(app_name)
        .config("spark.sql.extensions", "org.apache.iceberg.spark.extensions.IcebergSparkSessionExtensions")
        .config(f"spark.sql.catalog.{catalog}", "org.apache.iceberg.spark.SparkCatalog")
        .config(f"spark.sql.catalog.{catalog}.catalog-impl", "org.apache.iceberg.aws.glue.GlueCatalog")
        .config(f"spark.sql.catalog.{catalog}.io-impl", "org.apache.iceberg.aws.s3.S3FileIO")
        .config("spark.sql.defaultCatalog", catalog)
    )
    if warehouse:
        builder = builder.config(f"spark.sql.catalog.{catalog}.warehouse", warehouse)
    if region:
        builder = builder.config(f"spark.sql.catalog.{catalog}.client.region", region)

    # Reasonable Spark defaults for scans/joins
    builder = (
        builder
        .config("spark.sql.adaptive.enabled", "true")
        .config("spark.sql.adaptive.coalescePartitions.enabled", "true")
        .config("spark.sql.broadcastTimeout", "1800")
        .config("spark.network.timeout", "300s")
        .config("spark.executor.heartbeatInterval", "60s")
    )
    spark = builder.getOrCreate()
    return spark

def configure_spark_settings(spark: SparkSession, shuffle_partitions: int) -> None:
    spark.conf.set("spark.sql.shuffle.partitions", str(shuffle_partitions))
    logger.info(
        f"Spark configured: AQE ON, Coalesce ON, shuffle partitions={shuffle_partitions}"
    )

def run_tpch_query(spark: SparkSession, query_num: int, sql_query) -> Dict[str, Any]:
    query_name = f"TPC-H Query {query_num}"
    logger.info(f"Starting {query_name}")
    start_time = time.perf_counter()

    try:
        if query_num == 15 and isinstance(sql_query, list):
            for i, sql_stmt in enumerate(sql_query):
                logger.info(f"{query_name} - Executing statement {i+1}/3")
                if i == 1:
                    df = spark.sql(sql_stmt)
                    df.show()
                else:
                    spark.sql(sql_stmt)
        else:
            df = spark.sql(sql_query)
            df.show()

        end_time = time.perf_counter()
        execution_time = end_time - start_time
        logger.info(f"{query_name} completed successfully in {execution_time:.2f} seconds")
        return {"query_number": query_num, "time_seconds": execution_time, "status": "SUCCESS"}
    except Exception as e:
        end_time = time.perf_counter()
        execution_time = end_time - start_time
        logger.error(f"{query_name} failed after {execution_time:.2f} seconds - Error: {str(e)}")
        return {
            "query_number": query_num,
            "time_seconds": execution_time,
            "status": "FAILED",
            "error": str(e),
        }

def build_queries(catalog: str, database: str) -> Dict[int, Union[str, List[str]]]:
    def tbl(name: str) -> str:
        # backtick database and table because the db contains underscores and to be safe for any special chars
        return f"{catalog}.`{database}`.`{name}`"

    return {
        1: f"""SELECT
l_returnflag,
l_linestatus,
SUM(l_quantity) AS sum_qty,
SUM(l_extendedprice) AS sum_base_price,
SUM(l_extendedprice * (1 - l_discount)) AS sum_disc_price,
SUM(l_extendedprice * (1 - l_discount) * (1 + l_tax)) AS sum_charge,
AVG(l_quantity) AS avg_qty,
AVG(l_extendedprice) AS avg_price,
AVG(l_discount) AS avg_disc,
COUNT(*) AS count_order
FROM {tbl('lineitem')}
WHERE l_shipdate <= DATE '1998-12-01' - INTERVAL '90' DAY
GROUP BY l_returnflag, l_linestatus
ORDER BY l_returnflag, l_linestatus""",

        2: f"""SELECT
s_acctbal,
s_name,
n_name,
p_partkey,
p_mfgr,
s_address,
s_phone,
s_comment
FROM
{tbl('part')},
{tbl('supplier')},
{tbl('partsupp')},
{tbl('nation')},
{tbl('region')}
WHERE
p_partkey = ps_partkey
AND s_suppkey = ps_suppkey
AND p_size = 15
AND p_type LIKE '%BRASS'
AND s_nationkey = n_nationkey
AND n_regionkey = r_regionkey
AND r_name = 'EUROPE'
AND ps_supplycost = (
SELECT MIN(ps_supplycost)
FROM {tbl('partsupp')}, {tbl('supplier')}, {tbl('nation')}, {tbl('region')}
WHERE p_partkey = ps_partkey
AND s_suppkey = ps_suppkey
AND s_nationkey = n_nationkey
AND n_regionkey = r_regionkey
AND r_name = 'EUROPE'
)
ORDER BY
s_acctbal DESC,
n_name,
s_name,
p_partkey
LIMIT 100""",

        3: f"""SELECT
l_orderkey,
SUM(l_extendedprice * (1 - l_discount)) AS revenue,
o_orderdate,
o_shippriority
FROM
{tbl('customer')},
{tbl('orders')},
{tbl('lineitem')}
WHERE
c_mktsegment = 'BUILDING'
AND c_custkey = o_custkey
AND l_orderkey = o_orderkey
AND o_orderdate < DATE '1995-03-15'
AND l_shipdate > DATE '1995-03-15'
GROUP BY
l_orderkey,
o_orderdate,
o_shippriority
ORDER BY
revenue DESC,
o_orderdate
LIMIT 10""",

        4: f"""SELECT
o_orderpriority,
COUNT(*) AS order_count
FROM {tbl('orders')}
WHERE
o_orderdate >= DATE '1993-07-01'
AND o_orderdate < DATE '1993-07-01' + INTERVAL '3' MONTH
AND EXISTS (
SELECT *
FROM {tbl('lineitem')}
WHERE l_orderkey = o_orderkey
AND l_commitdate < l_receiptdate
)
GROUP BY o_orderpriority
ORDER BY o_orderpriority""",

        5: f"""SELECT
n_name,
SUM(l_extendedprice * (1 - l_discount)) AS revenue
FROM
{tbl('customer')},
{tbl('orders')},
{tbl('lineitem')},
{tbl('supplier')},
{tbl('nation')},
{tbl('region')}
WHERE
c_custkey = o_custkey
AND l_orderkey = o_orderkey
AND l_suppkey = s_suppkey
AND c_nationkey = s_nationkey
AND s_nationkey = n_nationkey
AND n_regionkey = r_regionkey
AND r_name = 'ASIA'
AND o_orderdate >= DATE '1994-01-01'
AND o_orderdate < DATE '1994-01-01' + INTERVAL '1' YEAR
GROUP BY n_name
ORDER BY revenue DESC""",

        6: f"""SELECT SUM(l_extendedprice * l_discount) AS revenue
FROM {tbl('lineitem')}
WHERE
l_shipdate >= DATE '1994-01-01'
AND l_shipdate < DATE '1994-01-01' + INTERVAL '1' YEAR
AND l_discount BETWEEN 0.06 - 0.01 AND 0.06 + 0.01
AND l_quantity < 24""",

        7: f"""SELECT
supp_nation,
cust_nation,
l_year,
SUM(volume) AS revenue
FROM (
SELECT
n1.n_name AS supp_nation,
n2.n_name AS cust_nation,
EXTRACT(YEAR FROM l_shipdate) AS l_year,
l_extendedprice * (1 - l_discount) AS volume
FROM
{tbl('supplier')},
{tbl('lineitem')},
{tbl('orders')},
{tbl('customer')},
{tbl('nation')} n1,
{tbl('nation')} n2
WHERE
s_suppkey = l_suppkey
AND o_orderkey = l_orderkey
AND c_custkey = o_custkey
AND s_nationkey = n1.n_nationkey
AND c_nationkey = n2.n_nationkey
AND ((n1.n_name = 'FRANCE' AND n2.n_name = 'GERMANY')
OR (n1.n_name = 'GERMANY' AND n2.n_name = 'FRANCE'))
AND l_shipdate BETWEEN DATE '1995-01-01' AND DATE '1996-12-31'
) AS shipping
GROUP BY supp_nation, cust_nation, l_year
ORDER BY supp_nation, cust_nation, l_year""",

        8: f"""SELECT
o_year,
SUM(CASE WHEN nation = 'BRAZIL' THEN volume ELSE 0 END) / SUM(volume) AS mkt_share
FROM (
SELECT
EXTRACT(YEAR FROM o_orderdate) AS o_year,
l_extendedprice * (1 - l_discount) AS volume,
n2.n_name AS nation
FROM
{tbl('part')},
{tbl('supplier')},
{tbl('lineitem')},
{tbl('orders')},
{tbl('customer')},
{tbl('nation')} n1,
{tbl('nation')} n2,
{tbl('region')}
WHERE
p_partkey = l_partkey
AND s_suppkey = l_suppkey
AND l_orderkey = o_orderkey
AND o_custkey = c_custkey
AND c_nationkey = n1.n_nationkey
AND n1.n_regionkey = r_regionkey
AND r_name = 'AMERICA'
AND s_nationkey = n2.n_nationkey
AND o_orderdate BETWEEN DATE '1995-01-01' AND DATE '1996-12-31'
AND p_type = 'ECONOMY ANODIZED STEEL'
) AS all_nations
GROUP BY o_year
ORDER BY o_year""",

        9: f"""SELECT
nation,
o_year,
SUM(amount) AS sum_profit
FROM (
SELECT
n_name AS nation,
EXTRACT(YEAR FROM o_orderdate) AS o_year,
l_extendedprice * (1 - l_discount) - ps_supplycost * l_quantity AS amount
FROM
{tbl('part')},
{tbl('supplier')},
{tbl('lineitem')},
{tbl('partsupp')},
{tbl('orders')},
{tbl('nation')}
WHERE
s_suppkey = l_suppkey
AND ps_suppkey = l_suppkey
AND ps_partkey = l_partkey
AND p_partkey = l_partkey
AND o_orderkey = l_orderkey
AND s_nationkey = n_nationkey
AND p_name LIKE '%green%'
) AS profit
GROUP BY nation, o_year
ORDER BY nation, o_year DESC""",

        10: f"""SELECT
c_custkey,
c_name,
SUM(l_extendedprice * (1 - l_discount)) AS revenue,
c_acctbal,
n_name,
c_address,
c_phone,
c_comment
FROM
{tbl('customer')},
{tbl('orders')},
{tbl('lineitem')},
{tbl('nation')}
WHERE
c_custkey = o_custkey
AND l_orderkey = o_orderkey
AND o_orderdate >= DATE '1993-10-01'
AND o_orderdate < DATE '1993-10-01' + INTERVAL '3' MONTH
AND l_returnflag = 'R'
AND c_nationkey = n_nationkey
GROUP BY
c_custkey,
c_name,
c_acctbal,
c_phone,
n_name,
c_address,
c_comment
ORDER BY revenue DESC
LIMIT 20""",

        11: f"""SELECT
ps_partkey,
SUM(ps_supplycost * ps_availqty) AS value
FROM
{tbl('partsupp')},
{tbl('supplier')},
{tbl('nation')}
WHERE
ps_suppkey = s_suppkey
AND s_nationkey = n_nationkey
AND n_name = 'GERMANY'
GROUP BY ps_partkey
HAVING SUM(ps_supplycost * ps_availqty) > (
SELECT SUM(ps_supplycost * ps_availqty) * 0.0001
FROM
{tbl('partsupp')},
{tbl('supplier')},
{tbl('nation')}
WHERE
ps_suppkey = s_suppkey
AND s_nationkey = n_nationkey
AND n_name = 'GERMANY'
)
ORDER BY value DESC""",

        12: f"""SELECT
l_shipmode,
SUM(CASE
WHEN o_orderpriority = '1-URGENT'
OR o_orderpriority = '2-HIGH'
THEN 1
ELSE 0
END) AS high_line_count,
SUM(CASE
WHEN o_orderpriority <> '1-URGENT'
AND o_orderpriority <> '2-HIGH'
THEN 1
ELSE 0
END) AS low_line_count
FROM
{tbl('orders')},
{tbl('lineitem')}
WHERE
o_orderkey = l_orderkey
AND l_shipmode IN ('MAIL', 'SHIP')
AND l_commitdate < l_receiptdate
AND l_shipdate < l_commitdate
AND l_receiptdate >= DATE '1994-01-01'
AND l_receiptdate < DATE '1994-01-01' + INTERVAL '1' YEAR
GROUP BY l_shipmode
ORDER BY l_shipmode""",

        13: f"""SELECT
c_count,
COUNT(*) AS custdist
FROM (
SELECT
c_custkey,
COUNT(o_orderkey) AS c_count
FROM
{tbl('customer')} LEFT OUTER JOIN {tbl('orders')} ON
c_custkey = o_custkey
AND o_comment NOT LIKE '%special%requests%'
GROUP BY c_custkey
) c_orders
GROUP BY c_count
ORDER BY custdist DESC, c_count DESC""",

        14: f"""SELECT
100.00 * SUM(CASE
WHEN p_type LIKE 'PROMO%'
THEN l_extendedprice * (1 - l_discount)
ELSE 0
END) / SUM(l_extendedprice * (1 - l_discount)) AS promo_revenue
FROM
{tbl('lineitem')},
{tbl('part')}
WHERE
l_partkey = p_partkey
AND l_shipdate >= DATE '1995-09-01'
AND l_shipdate < DATE '1995-09-01' + INTERVAL '1' MONTH""",

        15: [
            f"""CREATE OR REPLACE TEMPORARY VIEW revenue0 AS
            SELECT
              l_suppkey AS supplier_no,
              SUM(l_extendedprice * (1 - l_discount)) AS total_revenue
            FROM {tbl('lineitem')}
            WHERE
              l_shipdate >= DATE '1996-01-01'
              AND l_shipdate < DATE '1996-01-01' + INTERVAL '3' MONTH
            GROUP BY l_suppkey""",
            f"""SELECT
              s_suppkey,
              s_name,
              s_address,
              s_phone,
              total_revenue
            FROM
              {tbl('supplier')},
              revenue0
            WHERE
              s_suppkey = supplier_no
              AND total_revenue = (
                SELECT MAX(total_revenue) FROM revenue0
              )
            ORDER BY s_suppkey""",
            """DROP VIEW revenue0"""
        ],

        16: f"""SELECT
p_brand,
p_type,
p_size,
COUNT(DISTINCT ps_suppkey) AS supplier_cnt
FROM
{tbl('partsupp')},
{tbl('part')}
WHERE
p_partkey = ps_partkey
AND p_brand <> 'Brand#45'
AND p_type NOT LIKE 'MEDIUM POLISHED%'
AND p_size IN (49, 14, 23, 45, 19, 3, 36, 9)
AND ps_suppkey NOT IN (
SELECT s_suppkey
FROM {tbl('supplier')}
WHERE s_comment LIKE '%Customer%Complaints%'
)
GROUP BY p_brand, p_type, p_size
ORDER BY supplier_cnt DESC, p_brand, p_type, p_size""",

        17: f"""SELECT SUM(l_extendedprice) / 7.0 AS avg_yearly
FROM
{tbl('lineitem')},
{tbl('part')}
WHERE
p_partkey = l_partkey
AND p_brand = 'Brand#23'
AND p_container = 'MED BOX'
AND l_quantity < (
SELECT 0.2 * AVG(l_quantity)
FROM {tbl('lineitem')}
WHERE l_partkey = p_partkey
)""",

        18: f"""SELECT
c_name,
c_custkey,
o_orderkey,
o_orderdate,
o_totalprice,
SUM(l_quantity) AS sum_qty
FROM
{tbl('customer')},
{tbl('orders')},
{tbl('lineitem')}
WHERE
o_orderkey IN (
SELECT l_orderkey
FROM {tbl('lineitem')}
GROUP BY l_orderkey
HAVING SUM(l_quantity) > 300
)
AND c_custkey = o_custkey
AND o_orderkey = l_orderkey
GROUP BY
c_name,
c_custkey,
o_orderkey,
o_orderdate,
o_totalprice
ORDER BY o_totalprice DESC, o_orderdate
LIMIT 100""",

        19: f"""SELECT SUM(l_extendedprice * (1 - l_discount)) AS revenue
FROM
{tbl('lineitem')},
{tbl('part')}
WHERE
(
p_partkey = l_partkey
AND p_brand = 'Brand#12'
AND p_container IN ('SM CASE', 'SM BOX', 'SM PACK', 'SM PKG')
AND l_quantity >= 1 AND l_quantity <= 1 + 10
AND p_size BETWEEN 1 AND 5
AND l_shipmode IN ('AIR', 'AIR REG')
AND l_shipinstruct = 'DELIVER IN PERSON'
)
OR
(
p_partkey = l_partkey
AND p_brand = 'Brand#23'
AND p_container IN ('MED BAG', 'MED BOX', 'MED PKG', 'MED PACK')
AND l_quantity >= 10 AND l_quantity <= 10 + 10
AND p_size BETWEEN 1 AND 10
AND l_shipmode IN ('AIR', 'AIR REG')
AND l_shipinstruct = 'DELIVER IN PERSON'
)
OR
(
p_partkey = l_partkey
AND p_brand = 'Brand#34'
AND p_container IN ('LG CASE', 'LG BOX', 'LG PACK', 'LG PKG')
AND l_quantity >= 20 AND l_quantity <= 20 + 10
AND p_size BETWEEN 1 AND 15
AND l_shipmode IN ('AIR', 'AIR REG')
AND l_shipinstruct = 'DELIVER IN PERSON'
)""",

        20: f"""SELECT
s_name,
s_address
FROM
{tbl('supplier')},
{tbl('nation')}
WHERE
s_suppkey IN (
SELECT ps_suppkey
FROM {tbl('partsupp')}
WHERE ps_partkey IN (
SELECT p_partkey
FROM {tbl('part')}
WHERE p_name LIKE 'forest%'
)
AND ps_availqty > (
SELECT 0.5 * SUM(l_quantity)
FROM {tbl('lineitem')}
WHERE l_partkey = ps_partkey
AND l_suppkey = ps_suppkey
AND l_shipdate >= DATE '1994-01-01'
AND l_shipdate < DATE '1994-01-01' + INTERVAL '1' YEAR
)
)
AND s_nationkey = n_nationkey
AND n_name = 'CANADA'
ORDER BY s_name""",

        21: f"""SELECT
s_name,
COUNT(*) AS numwait
FROM
{tbl('supplier')},
{tbl('lineitem')} l1,
{tbl('orders')},
{tbl('nation')}
WHERE
s_suppkey = l1.l_suppkey
AND o_orderkey = l1.l_orderkey
AND o_orderstatus = 'F'
AND l1.l_receiptdate > l1.l_commitdate
AND EXISTS (
SELECT *
FROM {tbl('lineitem')} l2
WHERE l2.l_orderkey = l1.l_orderkey
AND l2.l_suppkey <> l1.l_suppkey
)
AND NOT EXISTS (
SELECT *
FROM {tbl('lineitem')} l3
WHERE l3.l_orderkey = l1.l_orderkey
AND l3.l_suppkey <> l1.l_suppkey
AND l3.l_receiptdate > l3.l_commitdate
)
AND s_nationkey = n_nationkey
AND n_name = 'SAUDI ARABIA'
GROUP BY s_name
ORDER BY numwait DESC, s_name
LIMIT 100""",

        22: f"""SELECT
cntrycode,
COUNT(*) AS numcust,
SUM(c_acctbal) AS totacctbal
FROM (
SELECT
SUBSTRING(c_phone, 1, 2) AS cntrycode,
c_acctbal
FROM {tbl('customer')}
WHERE SUBSTRING(c_phone, 1, 2) IN ('13', '31', '23', '29', '30', '18', '17')
AND c_acctbal > (
SELECT AVG(c_acctbal)
FROM {tbl('customer')}
WHERE c_acctbal > 0.00
AND SUBSTRING(c_phone, 1, 2) IN ('13', '31', '23', '29', '30', '18', '17')
)
AND NOT EXISTS (
SELECT *
FROM {tbl('orders')}
WHERE o_custkey = c_custkey
)
) AS custsale
GROUP BY cntrycode
ORDER BY cntrycode"""
    }

def run_all_tpch_queries(spark: SparkSession, queries: Dict[int, Union[str, List[str]]]) -> List[Dict[str, Any]]:
    all_results = []
    total_start_time = time.perf_counter()
    logger.info("Starting complete TPC-H benchmark run (22 queries)")

    for query_num in range(1, 23):
        if query_num in queries:
            result = run_tpch_query(spark, query_num, queries[query_num])
            all_results.append(result)
            time.sleep(0.5)

    total_end_time = time.perf_counter()
    total_time = total_end_time - total_start_time
    logger.info(f"Complete TPC-H benchmark finished in {total_time:.2f} seconds")

    print("\n" + "=" * 60)
    print("TPC-H BENCHMARK RESULTS SUMMARY")
    print("=" * 60)

    successful_queries = 0
    failed_queries = 0
    total_query_time = 0.0

    for result in all_results:
        status_symbol = "✓" if result["status"] == "SUCCESS" else "✗"
        print(f"{status_symbol} Query {result['query_number']:2d}: {result['time_seconds']:8.2f}s - {result['status']}")
        if result["status"] == "SUCCESS":
            successful_queries += 1
            total_query_time += result["time_seconds"]
        else:
            failed_queries += 1

    print("=" * 60)
    print(f"Successful queries: {successful_queries}/22")
    print(f"Failed queries: {failed_queries}/22")
    print(f"Total query execution time: {total_query_time:.2f} seconds")
    print(f"Total benchmark time: {total_time:.2f} seconds")
    print("=" * 60)

    return all_results

def main():
    parser = argparse.ArgumentParser(description="Run TPC-H on Iceberg (Glue catalog)")
    parser.add_argument("--catalog", default="glue", help="Iceberg catalog name (default: glue)")
    parser.add_argument("--database", default="postgres_postgres_tpch", help="Glue database name containing TPC-H tables")
    parser.add_argument("--warehouse", default=os.environ.get("ICEBERG_WAREHOUSE"), help="S3 warehouse path, e.g., s3://bucket/warehouse/")
    parser.add_argument("--region", default=os.environ.get("AWS_REGION"), help="AWS region for Glue/S3 (optional)")
    parser.add_argument("--shuffle-partitions", type=int, default=64, help="spark.sql.shuffle.partitions")
    args = parser.parse_args()

    spark = build_spark_session(
        app_name="TPC-H Iceberg Benchmark",
        catalog=args.catalog,
        warehouse=args.warehouse,
        region=args.region,
    )
    configure_spark_settings(spark, args.shuffle_partitions)

    queries = build_queries(args.catalog, args.database)
    _ = run_all_tpch_queries(spark, queries)

if __name__ == "__main__":
    main()
View the spark-submit command for TPC-H queries
spark-submit \
  --packages org.apache.iceberg:iceberg-spark-runtime-3.5_2.12:1.6.1,org.apache.iceberg:iceberg-aws-bundle:1.6.1 \
  --conf spark.sql.extensions=org.apache.iceberg.spark.extensions.IcebergSparkSessionExtensions \
  --conf spark.sql.catalog.glue=org.apache.iceberg.spark.SparkCatalog \
  --conf spark.sql.catalog.glue.catalog-impl=org.apache.iceberg.aws.glue.GlueCatalog \
  --conf spark.sql.catalog.glue.io-impl=org.apache.iceberg.aws.s3.S3FileIO \
  --conf spark.sql.catalog.glue.client.region=ap-south-1 \
  --conf spark.sql.catalog.glue.warehouse=s3://dz-olake-testing/new_tpch_data/full_load/ \
  --conf spark.dynamicAllocation.enabled=true \
  --conf spark.dynamicAllocation.minExecutors=2 \
  --conf spark.dynamicAllocation.initialExecutors=2 \
  --conf spark.dynamicAllocation.maxExecutors=12 \
  --conf spark.executor.cores=4 \
  --conf spark.executor.memory=48g \
  --conf spark.executor.memoryOverhead=8g \
  --conf spark.driver.memory=8g \
  --conf spark.driver.memoryOverhead=4g \
  --conf spark.memory.fraction=0.6 \
  --conf spark.memory.storageFraction=0.2 \
  --conf spark.sql.adaptive.enabled=true \
  --conf spark.sql.adaptive.coalescePartitions.enabled=true \
  --conf spark.sql.adaptive.skewJoin.enabled=true \
  --conf spark.sql.adaptive.advisoryPartitionSizeInBytes=128m \
  --conf spark.sql.shuffle.partitions=2000 \
  --conf spark.sql.autoBroadcastJoinThreshold=20m \
  --conf spark.sql.files.maxPartitionBytes=128m \
  --conf spark.sql.iceberg.vectorization.enabled=false \
  --conf spark.sql.parquet.enableVectorizedReader=false \
  --conf spark.network.timeout=600s \
  --conf spark.executor.heartbeatInterval=120s \
  --conf spark.sql.broadcastTimeout=1800 \
  --conf spark.reducer.maxReqsInFlight=2 \
  --conf spark.reducer.maxBlocksInFlightPerAddress=1 \
  --conf spark.reducer.maxSizeInFlight=24m \
  --conf spark.shuffle.io.maxRetries=10 \
  --conf spark.shuffle.io.retryWait=30s \
  --conf spark.task.maxFailures=8 \
  --conf spark.executor.extraJavaOptions="-XX:+UseG1GC -XX:InitiatingHeapOccupancyPercent=35 -XX:G1ReservePercent=20 -Darrow.enable_unsafe_memory_access=false -Darrow.enable_null_check_for_get=true" \
  --conf spark.driver.extraJavaOptions="-XX:+UseG1GC -XX:InitiatingHeapOccupancyPercent=35 -Darrow.enable_unsafe_memory_access=false -Darrow.enable_null_check_for_get=true -Xss8m" \
  --conf spark.executorEnv.AWS_EC2_METADATA_SERVICE_ENDPOINT=http://172.31.32.11:61847 \
  --conf spark.executorEnv.AWS_METADATA_SERVICE_TIMEOUT=50 \
  --conf spark.yarn.appMasterEnv.AWS_EC2_METADATA_SERVICE_ENDPOINT=http://172.31.32.11:61847 \
  --conf spark.yarn.appMasterEnv.AWS_METADATA_SERVICE_TIMEOUT=50 \
  /home/hadoop/tpch_script.py \
  --catalog glue --database "postgres_postgres_tpch" --region ap-south-1 --warehouse s3://dz-olake-testing/new_tpch_data/full_load/ --shuffle-partitions 2000 \
  2>&1 | tee tpch_benchmark_$(date +%Y%m%d_%H%M%S).log
Compacting the Table
Now we run Iceberg compaction across all eight TPC-H tables to merge thousands of small equality delete files into right-sized Parquet data files. After compaction, deletes are baked into the rewritten data files, so Iceberg no longer has to load and apply separate delete files at query time.
Iceberg’s rewrite_data_files uses a bin-packing strategy. It groups input files into “bins” that each target a specific output size: files are added to a bin until it reaches max-file-group-size-bytes, then a new bin starts. This keeps each rewrite task within a predictable memory budget while producing files close to target-file-size-bytes, which matters for us because table sizes and delete densities vary widely.
After compaction, the lineitem table (the largest in TPC-H) had only ~878 data files and no separate equality delete files — down from 1,843 data files and 1,000 equality deletes. That drop in file count is why each query reads far fewer files and runs faster.
View the compaction script
#!/usr/bin/env python3
"""
Iceberg compaction script - resilient, partial progress enabled.
- Processes easiest tables first, customer last.
- Continues on failure (partial success is fine).
- Enables partial-progress so completed groups are committed even if later groups fail.
"""
import logging
import time
from pyspark.sql import SparkSession

# --------------------------------------------------
# LOGGING SETUP
# --------------------------------------------------
logging.basicConfig(
    level=logging.INFO,
    format="%(asctime)s %(levelname)s %(message)s",
)
logger = logging.getLogger("iceberg-compaction")

# --------------------------------------------------
# CONFIGURATION
# --------------------------------------------------
CATALOG = "glue"
DATABASE = "postgres_postgres_tpch"
# Order: easiest/smallest first, customer (180K deletes) last
TABLES = [
    "region", "nation", "supplier",
    "part", "partsupp", "orders", "lineitem",
    "customer",
]
# Set to ["customer"] to skip customer and run it separately with higher memory
SKIP_TABLES = []

# --------------------------------------------------
# DATA FILE COMPACTION OPTIONS
# --------------------------------------------------
# Base options: smaller groups = less memory per task
BASE_OPTIONS = {
    "min-input-files": "1",  # Must be 1: Iceberg only groups files within same partition; 2+ causes "Nothing found"
    "min-file-size-bytes": str(256 * 1024 * 1024),   # 256 MB - files smaller than this are compaction candidates
    "target-file-size-bytes": str(512 * 1024 * 1024),  # 512 MB - target must be > min-file-size-bytes
    "max-file-group-size-bytes": str(128 * 1024 * 1024),  # 128 MB
    "max-concurrent-file-group-rewrites": "6",
    "partial-progress.enabled": "true",
    "partial-progress.max-commits": "150",
    "rewrite-job-order": "bytes-asc",  # Process smaller files first
    "rewrite-all": "true",  # Force rewrite all files; planner otherwise finds nothing with equality deletes
}

# Heavier tables (delete-heavy) - smaller groups reduce OOM risk
HEAVY_TABLE_OPTIONS = {
    "customer": {
        "max-file-group-size-bytes": str(128 * 1024 * 1024),  # 64 MB
        "partial-progress.max-commits": "150",  # 180K deletes need more commits
    },
    "lineitem": {"max-file-group-size-bytes": str(128 * 1024 * 1024)},  # 128 MB
    "supplier": {"max-file-group-size-bytes": str(128 * 1024 * 1024)},   # 64 MB
}

# --------------------------------------------------
# HELPER: convert dict to Spark SQL MAP
# --------------------------------------------------
def map_sql(opts: dict) -> str:
    pairs = []
    for k, v in opts.items():
        pairs.append(f"'{k}'")
        pairs.append(f"'{v}'")
    return "map(" + ",".join(pairs) + ")"

# --------------------------------------------------
# SPARK SESSION
# --------------------------------------------------
spark = (
    SparkSession.builder
    .appName("iceberg-compaction-with-logging")
    .getOrCreate()
)
# Disable Iceberg vectorized Parquet reads - avoids zstd/Arrow crash on aarch64
spark.conf.set("spark.sql.catalog.glue.read.parquet.vectorization.enabled", "false")

# --------------------------------------------------
# COMPACTION LOOP
# --------------------------------------------------
overall_start = time.time()
summary = []

for table in TABLES:
    if table in SKIP_TABLES:
        logger.info(f"Skipping table {table} (in SKIP_TABLES)")
        summary.append((table, "SKIPPED", 0, 0))
        continue
    full_table = f"{DATABASE}.{table}"
    table_start = time.time()
    opts = dict(BASE_OPTIONS)
    opts.update(HEAVY_TABLE_OPTIONS.get(table, {}))

    logger.info("=" * 80)
    logger.info(f"Starting compaction for table: {CATALOG}.{full_table}")

    try:
        # Temporarily disable vectorization at table level
        try:
            spark.sql(f"""
                ALTER TABLE {CATALOG}.{full_table}
                SET TBLPROPERTIES (
                    'read.parquet.vectorization.enabled' = 'false'
                )
            """)
        except Exception as e:
            logger.warning(f"Could not set table property (may not exist): {e}")

        data_start = time.time()
        logger.info("Compaction options: %s", opts)
        logger.info("Starting data file rewrite")

        spark.sql(f"""
            CALL {CATALOG}.system.rewrite_data_files(
                table   => '{full_table}',
                options => {map_sql(opts)}
            )
        """)

        data_time = time.time() - data_start
        table_time = time.time() - table_start
        logger.info(f"Finished data file rewrite in {data_time:.2f} seconds")
        logger.info(f"Finished compaction for table {table} in {table_time / 60:.2f} minutes")
        summary.append((table, "OK", data_time, table_time / 60))

    except Exception as e:
        table_time = time.time() - table_start
        logger.warning(f"Compaction FAILED for table {table}: {e}")
        logger.info(f"Skipping to next table (partial success is fine)")
        summary.append((table, "FAILED", 0, table_time / 60))

# --------------------------------------------------
# SUMMARY LOG
# --------------------------------------------------
logger.info("=" * 80)
logger.info("COMPACTION SUMMARY")
logger.info("TABLE      | STATUS  | DATA_SEC  | TOTAL_MIN")
logger.info("-" * 80)

for item in summary:
    table, status, data_sec, total_min = item
    logger.info(
        f"{table:<10} | {status:<7} | {data_sec:>8.2f} | {total_min:>9.2f}"
    )

overall_time = time.time() - overall_start
logger.info("-" * 80)
logger.info(
    f"Total compaction runtime: {overall_time / 60:.2f} minutes"
)

spark.stop()
View the spark-submit command
spark-submit \
  --packages org.apache.iceberg:iceberg-spark-runtime-3.5_2.12:1.6.1,org.apache.iceberg:iceberg-aws-bundle:1.6.1 \
  \
  --conf spark.sql.extensions=org.apache.iceberg.spark.extensions.IcebergSparkSessionExtensions \
  --conf spark.sql.catalog.glue=org.apache.iceberg.spark.SparkCatalog \
  --conf spark.sql.catalog.glue.catalog-impl=org.apache.iceberg.aws.glue.GlueCatalog \
  --conf spark.sql.catalog.glue.io-impl=org.apache.iceberg.aws.s3.S3FileIO \
  --conf spark.sql.catalog.glue.client.region=ap-south-1 \
  --conf spark.sql.catalog.glue.warehouse=s3://dz-olake-testing/new_tpch_data/full_load/ \
  --conf spark.sql.defaultCatalog=glue \
  \
  --conf spark.dynamicAllocation.enabled=false \
  --conf spark.executor.instances=6 \
  --conf spark.executor.cores=1 \
  --conf spark.executor.memory=65g \
  --conf spark.executor.memoryOverhead=30g \
  \
  --conf spark.driver.memory=8g \
  --conf spark.driver.memoryOverhead=4g \
  \
  --conf spark.memory.fraction=0.6 \
  --conf spark.memory.storageFraction=0.2 \
  \
  --conf spark.sql.shuffle.partitions=48 \
  --conf spark.sql.adaptive.enabled=true \
  \
  --conf spark.sql.files.maxPartitionBytes=64m \
  \
  --conf spark.network.timeout=900s \
  --conf spark.executor.heartbeatInterval=120s \
  \
  --conf spark.task.maxFailures=8 \
  --conf spark.sql.parquet.enableVectorizedReader=false \
  --conf spark.sql.iceberg.vectorization.enabled=false \
  --conf spark.hadoop.io.native.lib.available=false \
  \
  --conf spark.executor.extraJavaOptions="-XX:+UseG1GC -XX:InitiatingHeapOccupancyPercent=35 -XX:G1ReservePercent=20 -XX:UseAVX=0 -Darrow.enable_unsafe_memory_access=false -Darrow.enable_null_check_for_get=true -Dhadoop.io.native.lib.available=false" \
  --conf spark.driver.extraJavaOptions="-XX:+UseG1GC -XX:InitiatingHeapOccupancyPercent=35 -Xss8m -XX:UseAVX=0 -Darrow.enable_unsafe_memory_access=false -Darrow.enable_null_check_for_get=true" \
  \
  --conf spark.executorEnv.AWS_EC2_METADATA_SERVICE_ENDPOINT=http://172.31.32.11:61847 \
  --conf spark.executorEnv.AWS_METADATA_SERVICE_TIMEOUT=50 \
  --conf spark.yarn.appMasterEnv.AWS_EC2_METADATA_SERVICE_ENDPOINT=http://172.31.32.11:61847 \
  --conf spark.yarn.appMasterEnv.AWS_METADATA_SERVICE_TIMEOUT=50 \
  \
  compaction_script.py \
  2>&1 | tee iceberg_compaction_$(date +%Y%m%d_%H%M%S).log
Post Compaction TPC-H Benchmark Results
With compaction complete across all eight TPC-H tables, we ran the full 22-query benchmark again on the same EMR cluster and Spark configuration. The only change was the data layout: compacted tables instead of fragmented ones.
All 22 queries completed successfully and without interruption. The benchmark finished in 7,377 seconds (~2 hours), with stable execution throughout—no out-of-memory errors, retries, or restarts. Resource usage remained consistent, and the workload progressed smoothly from start to finish.
Cost, Time and Memory Comparison
Putting the numbers side by side makes it clear what compaction actually bought us. This section breaks down query execution time, cluster cost, and what it means in practice.
1. Execution time: before and after compaction
Query-by-query comparison
| Query | Pre-compaction (s) | Post-compaction (s) |
|---|---|---|
| 1 | 404.93 | 414.20 |
| 2 | 1,359.29 | 91.39 |
| 3 | 2,274.12 | 290.27 |
| 4 | 2,531.03 | 580.32 |
| 5 | 2,416.23 | 407.84 |
| 6 | 138.04 | 129.35 |
| 7 | 2,360.68 | 302.40 |
| 8 | 2,599.59 | 415.18 |
| 9 | 3,319.00 | 516.46 |
| 10 | 2,220.67 | 250.50 |
| 11 | 1,330.70 | 70.15 |
| 12 | 2,227.72 | 239.76 |
| 13 | — | 137.29 |
| 14 | 193.71 | 154.39 |
| 15 | 300.50 | 278.50 |
| 16 | 685.78 | 47.71 |
| 17 | 516.52 | 476.27 |
| 18 | 2,440.97 | 546.01 |
| 19 | 226.53 | 186.66 |
| 20 | 856.24 | 205.77 |
| 21 | 3,390.34 | 1,496.98 |
| 22 | 2,158.93 | 139.75 |
| Total | 34,635 | 7,377 |
Total query execution time on the fragmented table was 34,635 seconds (about 9.7 hours). After compaction, total execution time dropped to 7,377 seconds (about 2 hours). That’s roughly 4.7× faster for the same workload on the same hardware and Spark config.
Many queries saw massive improvements — some ran up to 6× faster. The heaviest joins and shuffles benefited the most, since compaction removed the delete-file overhead and let the engine read fewer, better-organized files.
The takeaway is straightforward: the small-file problem wasn’t a minor slowdown. It was costing us hours of runtime. Compaction fixed that.
2. Cost: what we paid for each run
EMR cluster cost:
- Master (m6g.8xlarge): $0.810/hr
- Worker (r6g.4xlarge): $0.520/hr
- TPC-H worker nodes (Pre-compaction)
- TPC-H worker nodes (Post-Compaction)
- Compaction worker nodes
| Metric | Pre-compaction | Post-compaction | Compaction |
|---|---|---|---|
| Benchmark duration | ~9 h 39 min | ~2 h 7 min | 3.03 h |
| Master cost | ~$7.82 | ~$1.71 | ~$2.45 |
| Worker cost | ~$19.49 | ~$2.90 | ~$5.92 |
| Total cost | ~$27.31 | ~$4.61 | ~$8.37 |
That’s a ~6× cost drop: from about $27.31 down to $4.61 for the same benchmark.
For teams running TPC-H or similar workloads on fragmented Iceberg tables, this is the real story. Compaction doesn’t just improve query latency; it shortens job duration and reduces cluster spend. The savings compound as you run more benchmarks or production jobs on the same tables. As small files keep increasing over time, you would need to keep upgrading your EMR cluster size and run for more hours — and your costs would keep multiplying. Compaction breaks that cycle.
What about the cost of compaction itself? As the table above shows, compaction costs about $8.37. We do not have to run compaction daily; it can be scheduled based on how many small files are being generated. Once compaction runs, query costs drop sharply. Even when we include compaction cost ($8.37) plus the post-compaction query run ($4.61), the total comes to about ~$13, still well under the $28 we spent on the pre-compaction run alone. That's a clear saving for a single benchmark, and it compounds as we run more jobs over time.
As more data and small files accumulate over time, the gap widens:
| Scenario | Without compaction (approx.) | With compaction (approx.) |
|---|---|---|
| 4 runs (e.g. weekly) | ~$112+ (runs get slower and cost more as fragmentation grows) | ~$8 compaction + ~$19 (4 runs) ≈ $27 |
| 12 runs (e.g. over 3 months) | ~$336+ (and climbing; may need bigger clusters) | ~$17 compaction (2×) + ~$56 (12 runs) ≈ $73 |
Without compaction, each run stays expensive and gets worse as small files pile up. With compaction, you pay upfront once in a while, and query costs stay low.
3. Memory utilization
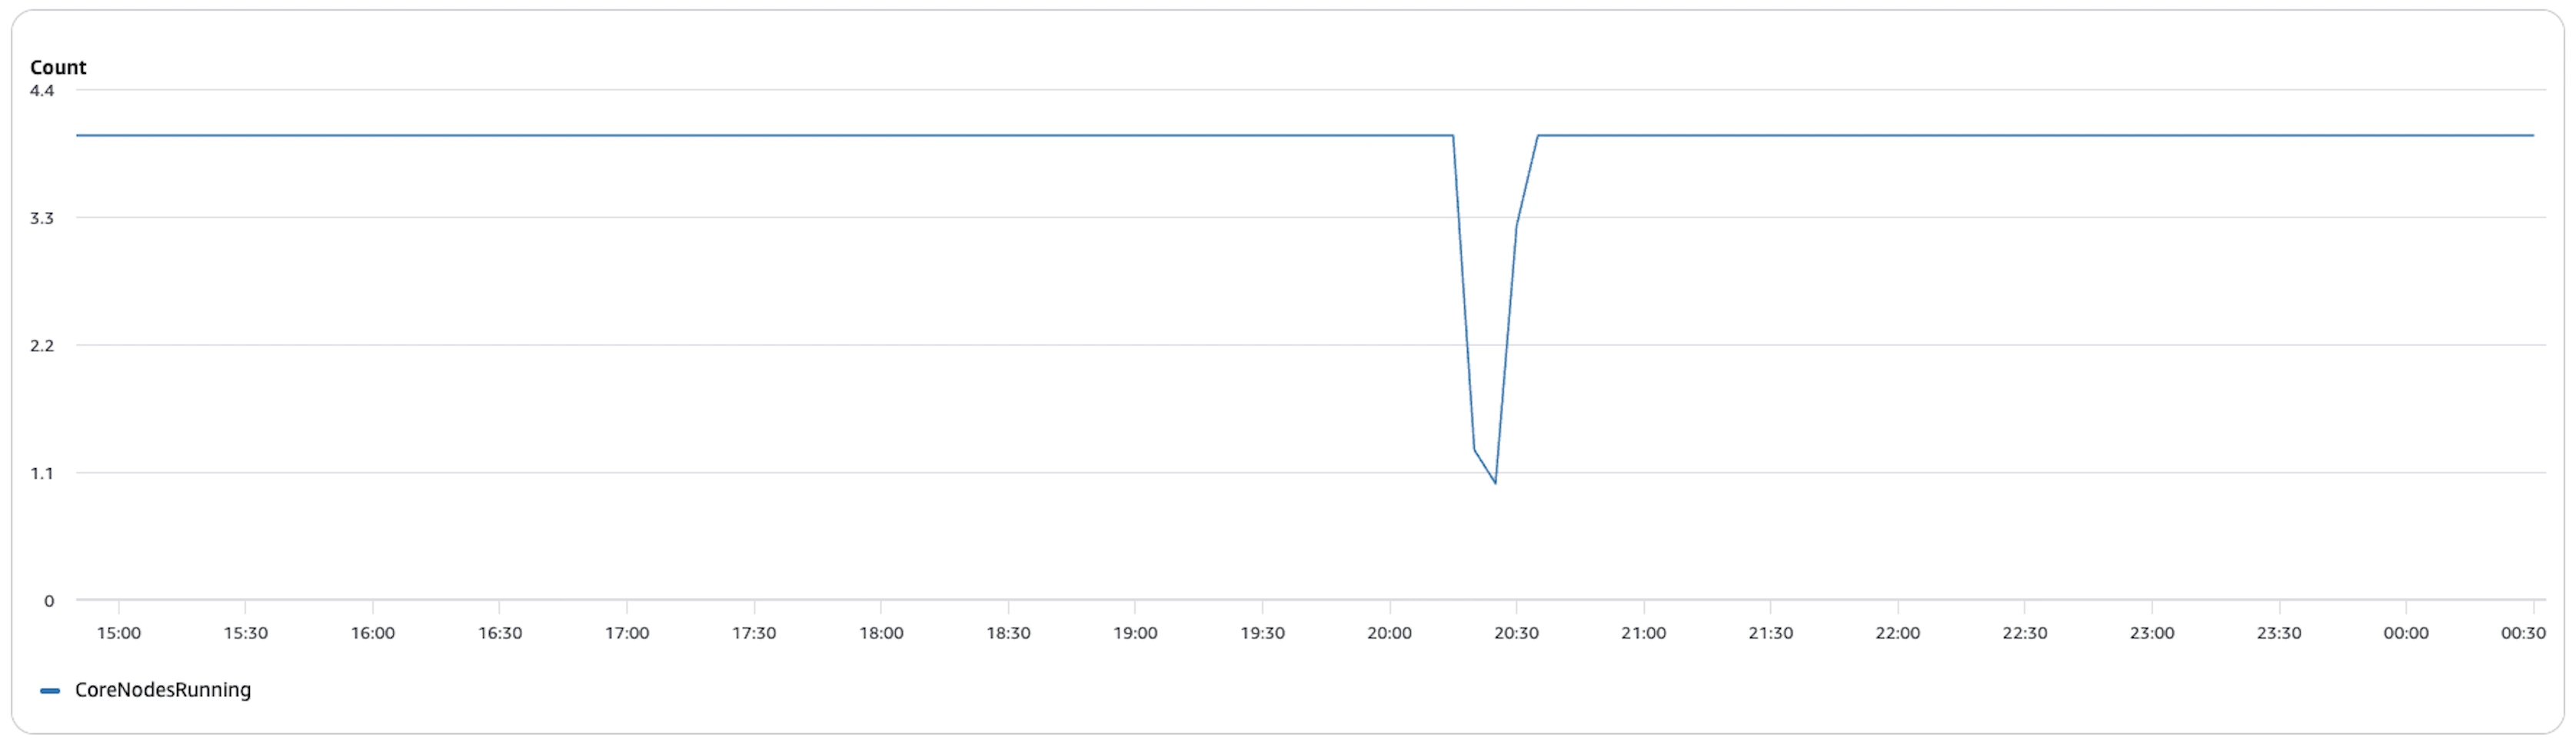
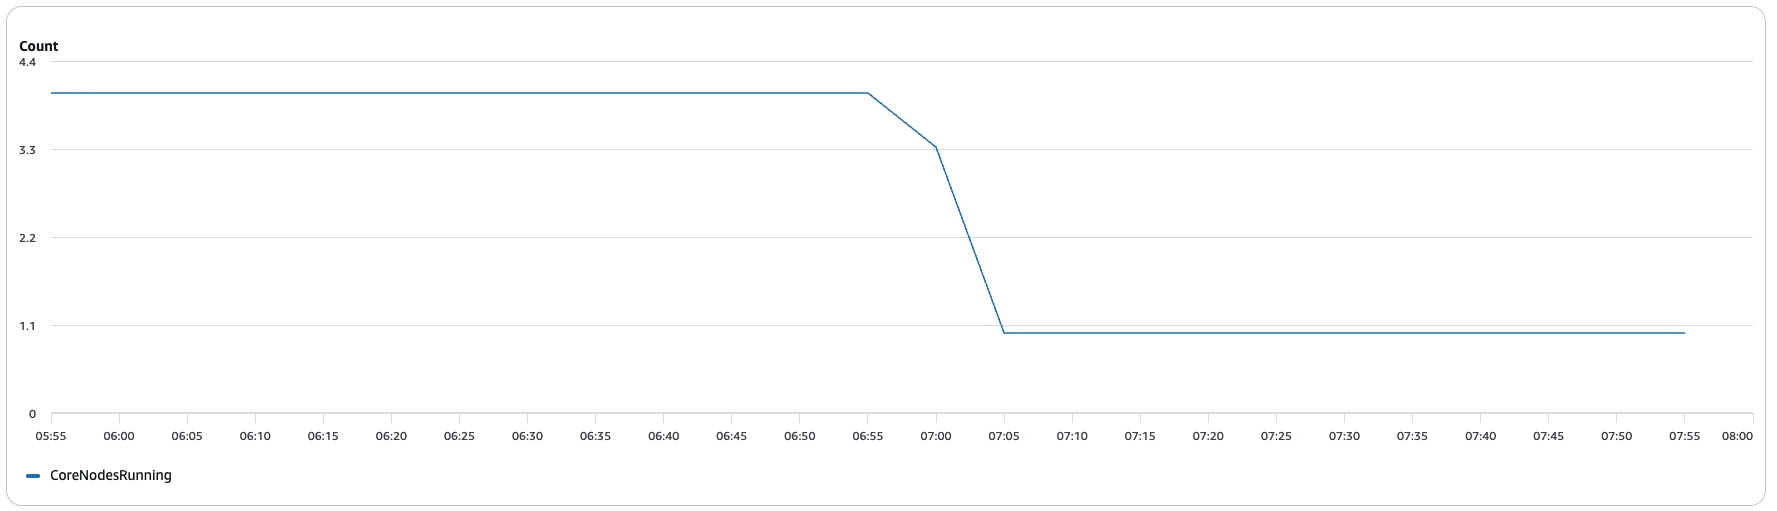
- Pre-compaction memory allocated
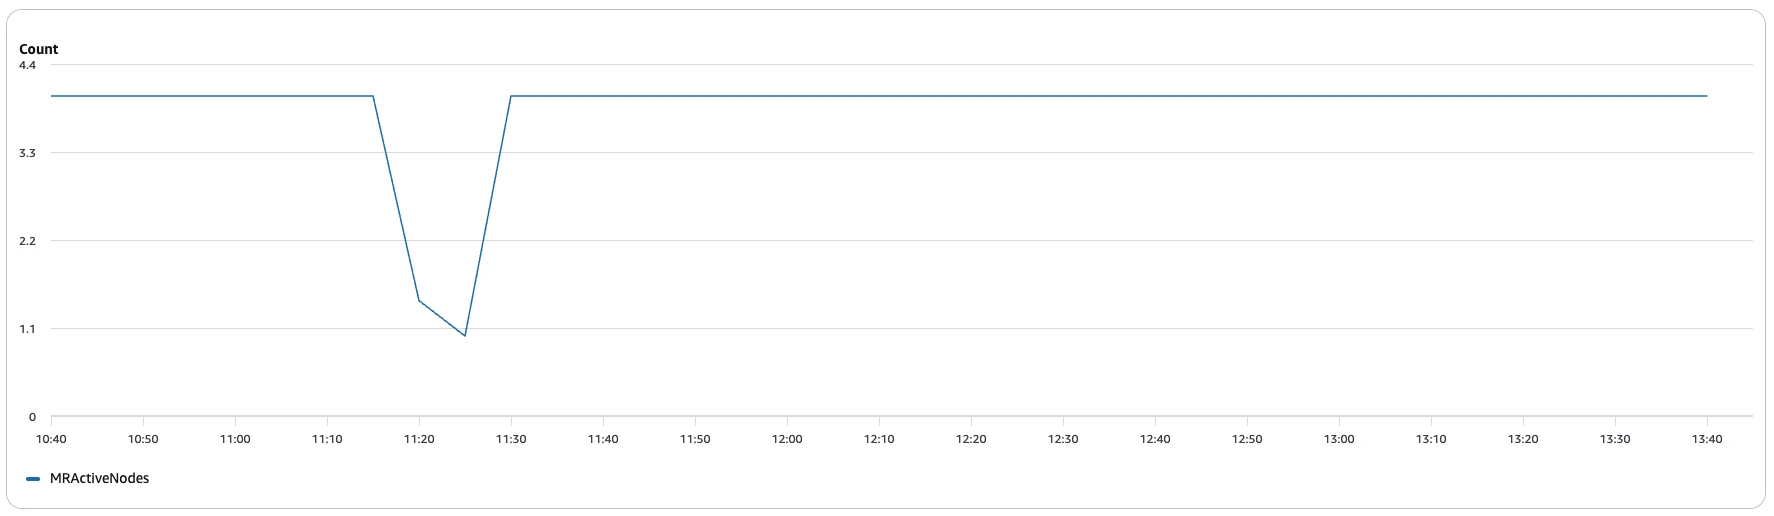
- Post-compaction memory allocated
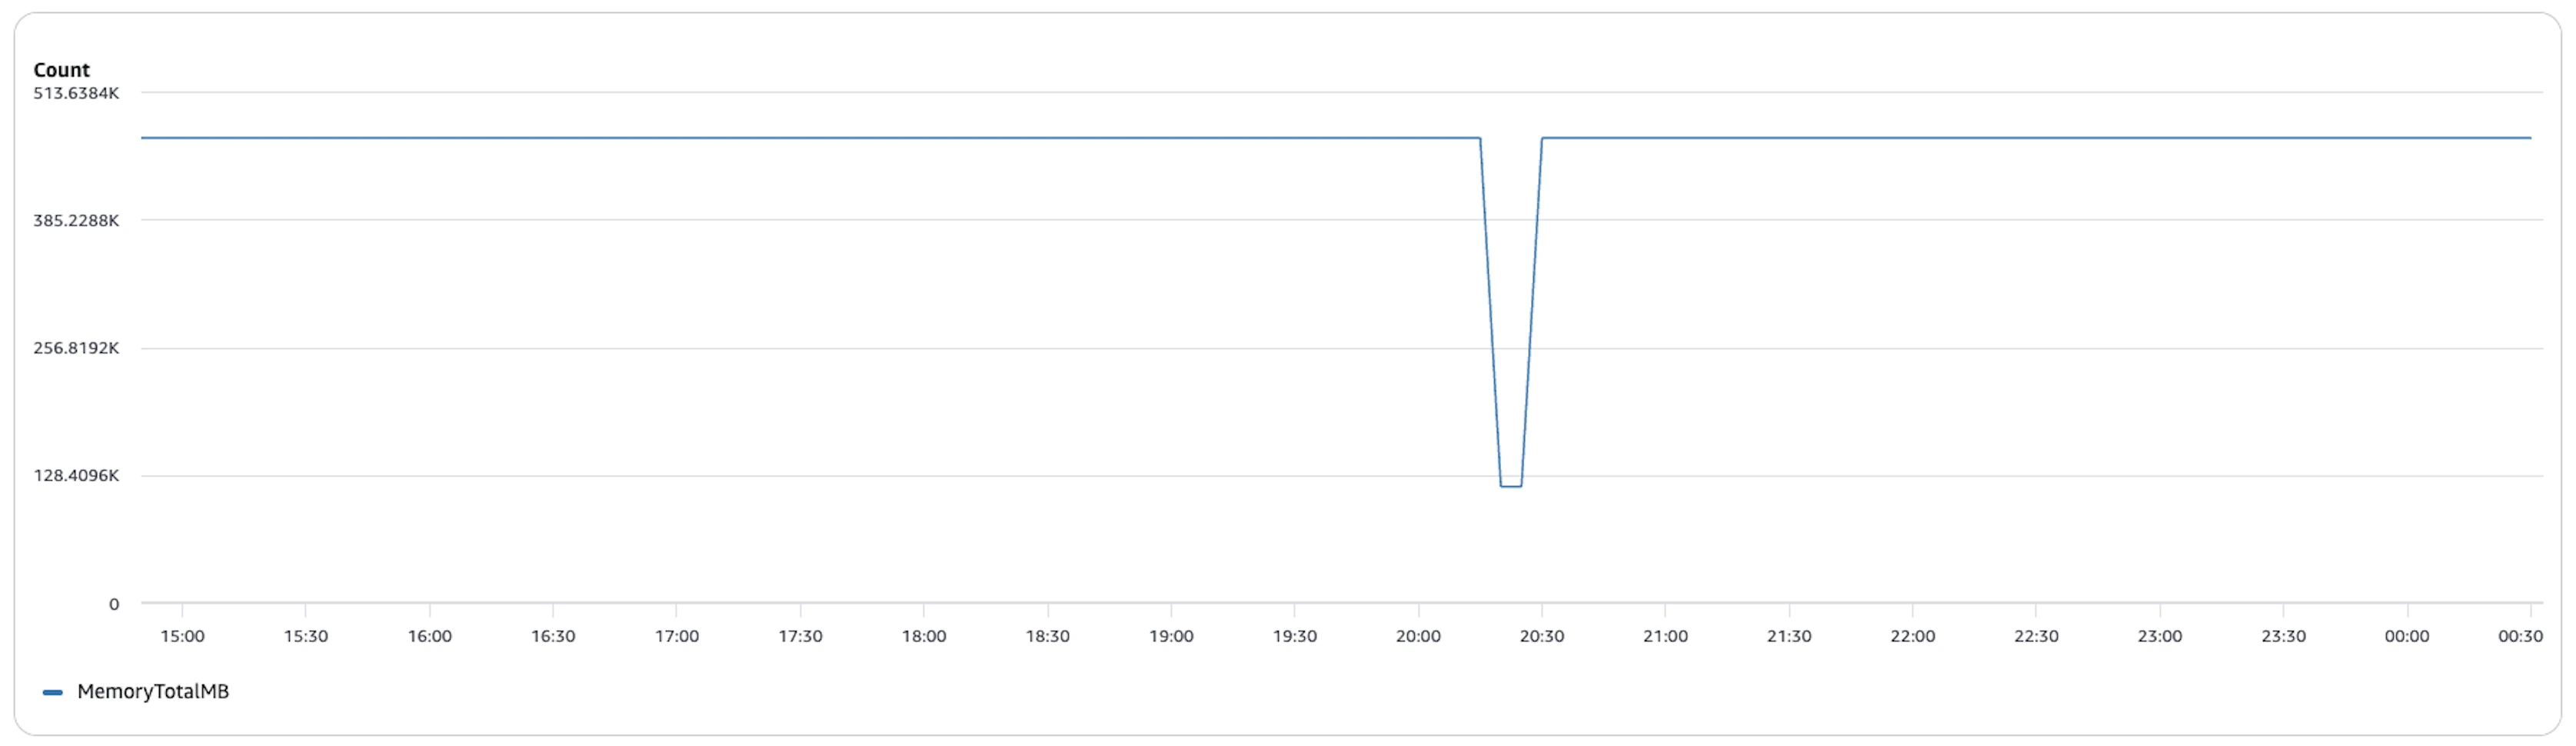
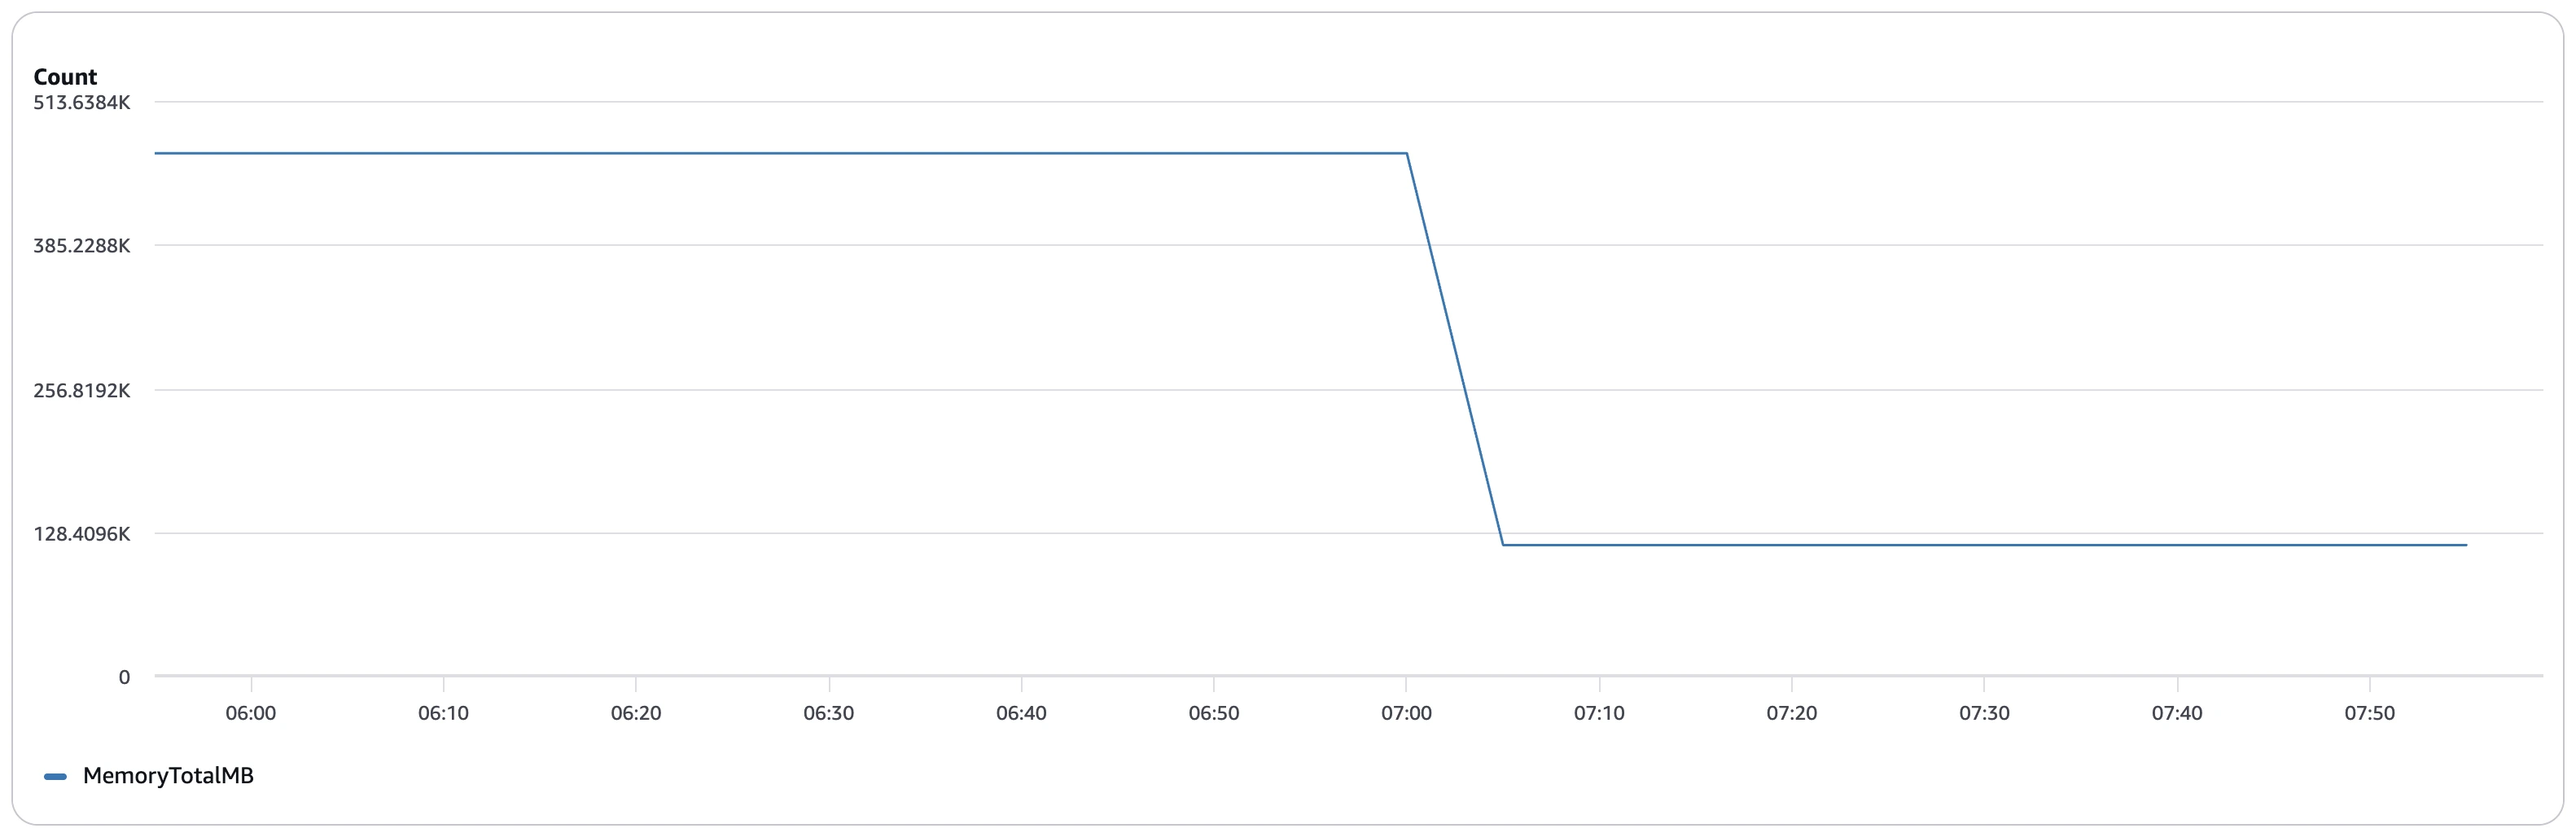
Average memory usage before compaction: ~456,000 MB (~445 GB) across the cluster over a ~9.5-hour run — and this was even with 16 vCPU and 128 GB RAM worker nodes. Without compaction, the engine had to load and process numerous small data files along with equality delete files separately, leading to higher memory overhead and inefficient resource utilization.
Average memory usage after compaction: remained around ~456,000 MB (~445 GB) during execution but only for a much shorter runtime. The graph shows a brief drop in memory utilization as tasks completed, reflecting how bin-pack compaction reduced file fragmentation and eliminated the overhead of processing equality delete files separately. With fewer files to scan and merge at query time, the workload finished significantly faster.
Advantage: While peak memory requirements remained similar, compaction dramatically reduced the time for which the cluster needed to sustain high memory usage. This translates to faster query completion, improved cluster efficiency, and significantly lower overall compute cost.
Conclusion
This experiment set out to put a real number on something the Iceberg community talks about often but rarely quantifies: the cost of skipping compaction on a CDC-heavy lakehouse. After running 22 TPC-H queries across 1 TB of deliberately fragmented data and then again after compaction, the answer came back clearly — a 4.6x reduction in total query time.
But beyond the raw numbers, what this experiment demonstrated is that compaction delivers advantages that go well beyond simple query speed:
- Query reliability: Query 13 didn't just run slowly pre-compaction — it failed completely due to S3 port exhaustion from thousands of concurrent file requests. Compaction eliminated those small files entirely, and the query ran in 137 seconds without a single retry. A well-compacted table is a stable table.
- Lower infrastructure overhead: The fragmented dataset forced us to upgrade worker RAM and expand EBS storage just to get stable results. Compaction reduces the memory pressure Iceberg places on executors during reads, which means smaller and cheaper clusters can handle the same workload reliably.
- Consistent, predictable performance: Complex multi-table joins improved by anywhere from 5x to nearly 20x after compaction, while simple single-table queries stayed roughly the same. The more analytical complexity your queries have, the more compaction pays off.
- S3 cost reduction: Thousands of small equality delete files mean thousands of individual S3 GET requests per query. At scale, that adds up fast on your cloud bill. Compacted tables make far fewer, larger object requests — which is both faster and cheaper.
If you run CDC into Iceberg, schedule compaction as part of your maintenance routine. Your queries and your cloud bill will thank you.
OLake
Achieve 5x speed data replication to Lakehouse format with OLake, our open source platform for efficient, quick and scalable big data ingestion for real-time analytics.