Best Data Observability Tools in 2026, Compared
31 min read
Key takeaways
Data observability tools watch your tables and tap you on the shoulder when something looks off, like late data, a sudden drop in rows or a changed column. Small team? Start free with Metaplane (10 tables), Soda (Free plan) or Elementary's open-source tool if you use dbt.
Big company with lots of tables? Look at Monte Carlo, Bigeye, Sifflet, Acceldata or Anomalo, but plan on a demo call, because none of them shows a dollar price on its own page. Of the pages we read, Soda is the only one with a public price for a paid plan ($750 a month for Team (checked Oct 2026)).
- Most vendors don't publish a price. Monte Carlo, Bigeye, Sifflet, Acceldata, Anomalo and Datafold show no dollar figure on the pages we read. Soda shows $750 a month for Team, and Metaplane shows a $0 plan (checked Oct 2026).
- The billing unit matters more than the list price. Vendors charge by monitored table, by asset, by credit or by plan. Ask how your own table count turns into a bill, because that's where the surprises hide.
- Free is possible. Good news: Metaplane's Free plan covers 10 tables, Soda has a Free plan, and Elementary's open-source tool is free if you run dbt.
- The market is moving. Datadog bought Metaplane (announced 2025-04-23), and Coalesce bought SYNQ (announced 2026-03-10). Several vendors now call themselves AI trust or control platforms. Older lists miss this.
- Fit beats features. Elementary's free tool needs dbt. Soda Core alone has no observability features. Datafold is more about comparing data before and after a change than watching tables.
Picture this. You open the sales dashboard and it says zero orders for yesterday. The cause is a late load or a renamed column, and nobody noticed until a manager asked (not a fun meeting).
Data observability is about catching that kind of failure before a person does. International Business Machines (IBM) defines it as "the practice of monitoring, managing and maintaining data in a way that ensures its quality, availability and reliability" across a company's systems and pipelines (the paths data travels).
Last reviewed October 2026.
What data observability tools check
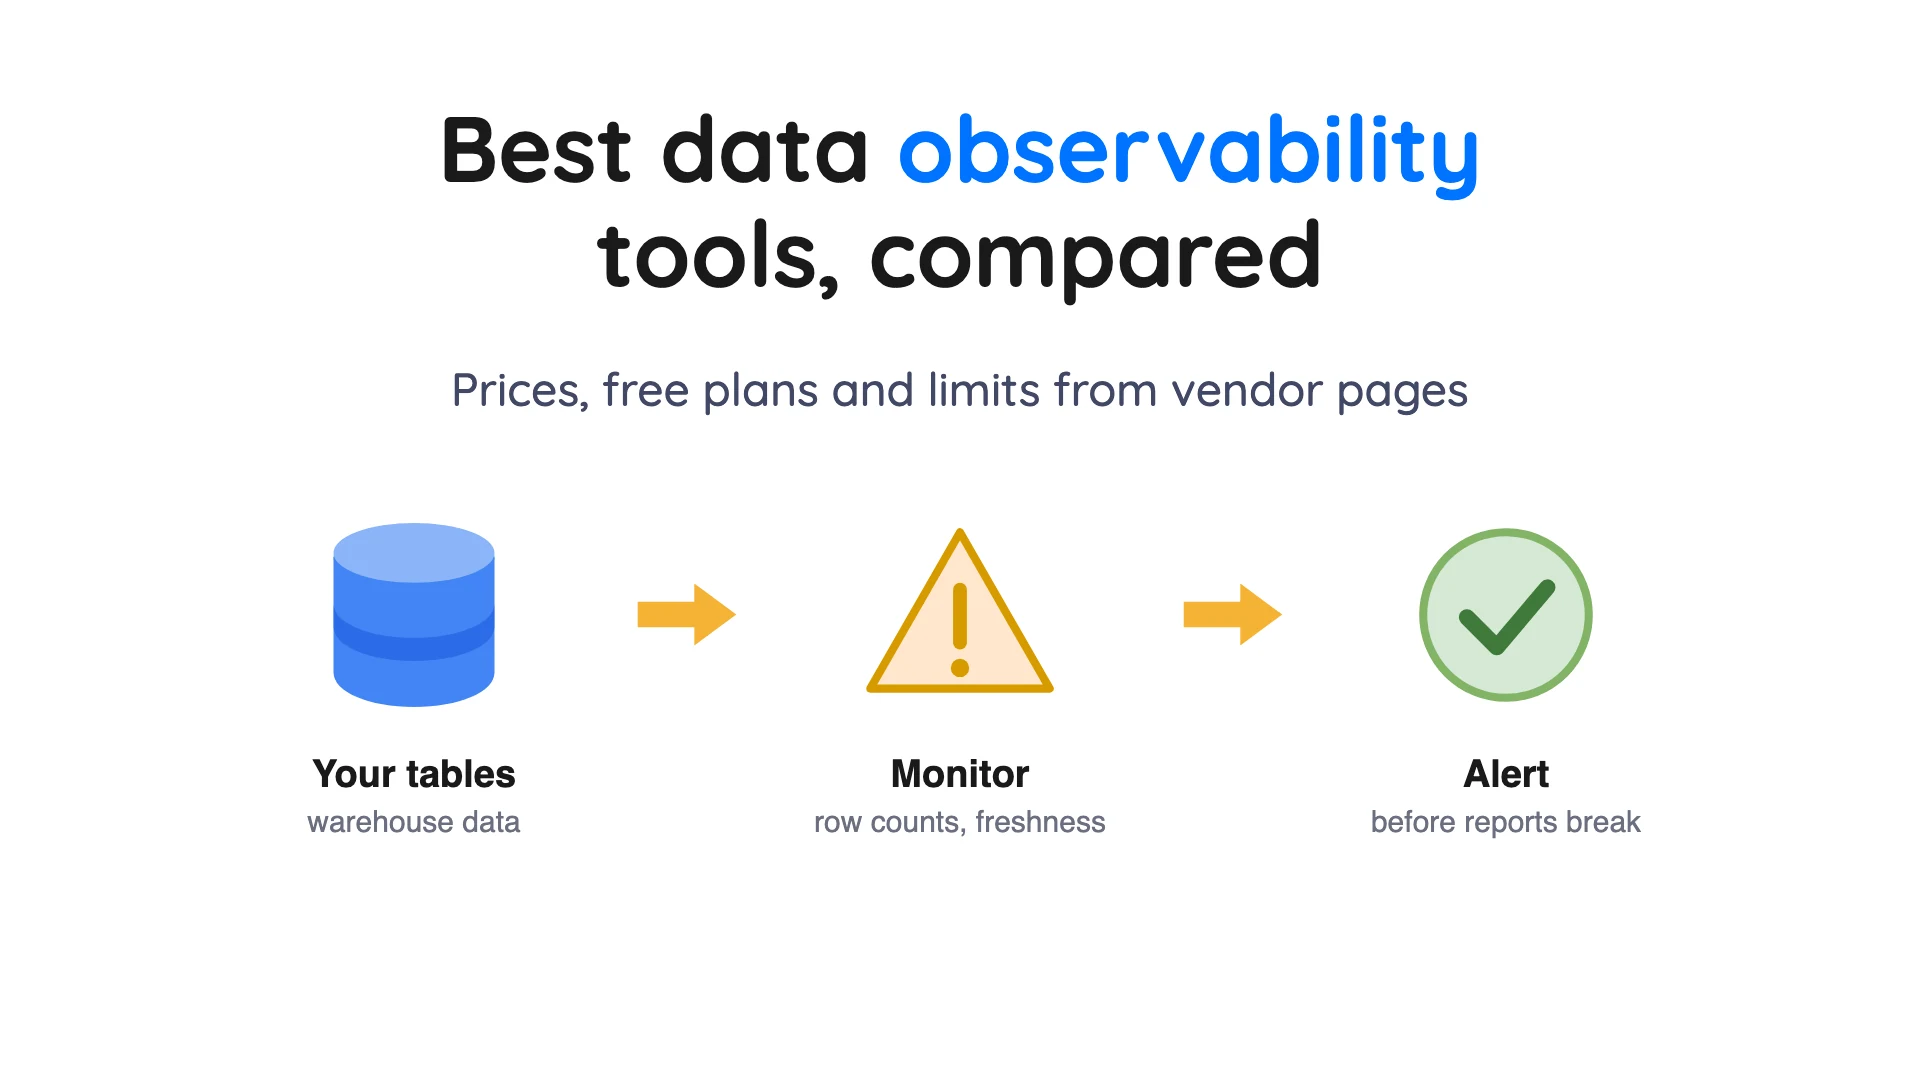
Here's the short version. A data observability tool plugs into your data warehouse (a database built for reports and analysis), records facts about each table, and learns what normal looks like. When a table drifts from that pattern, you get an alert.
IBM lists five pillars, which are just five kinds of signal. They are freshness (how up to date data is), distribution (whether values fall in an accepted range), volume, schema (how the data is organised) and lineage (where data came from and what depends on it).
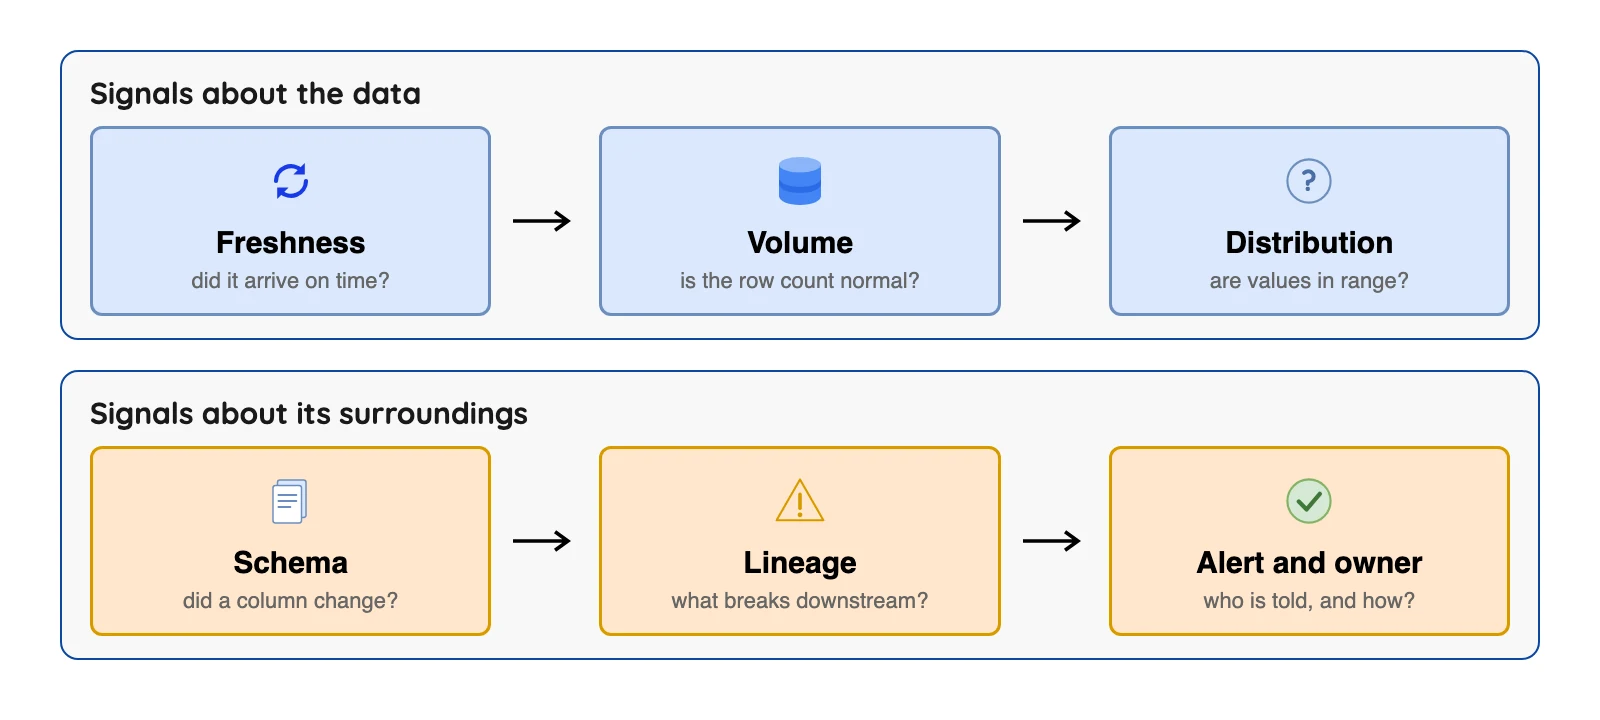
Here's a made-up example. A table that usually gains thousands of rows a day suddenly gains a handful, so the volume signal fires. Then the price column starts holding text, and the schema or distribution signal fires too.
Observability sounds a lot like data quality testing, but they're not the same thing. Soda's docs describe the split as testing during development and observability for monitoring production data for anomalies.
Tests check rules a person writes. Observability tools learn the normal pattern on their own and flag anything that breaks it.
How we picked
The rules were simple: each tool had to call itself data observability or data quality monitoring, have a public product page, and still be on sale in October 2026. Our sources are each vendor's own homepage, pricing page and docs, read in October 2026 and quoted with the date. Fair warning: nobody here installed or ran a tool, so this is a reading of documents, not a lab test.
Words like "autonomous", "AI trust" and "machine learning monitors" are the vendors' own descriptions. We didn't test what any monitor catches or how many false alerts it sends.
We skipped general software monitors such as application performance tools, because they watch servers, not tables. Data catalogs and pure testing libraries are out too, since a separate list covers them (best data quality tools).
Prices and limits were checked in October 2026 against each vendor's own page, and plans change often, so confirm before you decide. The order below puts paid platforms first and open-source tools last. It is not a ranking.
Data observability tools at a glance
| Tool | Best for | Model | Free route | Price on its own page |
|---|---|---|---|---|
| Monte Carlo | Large estates, many teams | Licence not stated | None mentioned | Not published; credits by tier |
| Metaplane by Datadog | Small teams starting out | Proprietary SaaS | Free plan, 10 tables | Free $0; Pro per monitored table, rate not shown (checked Oct 2026) |
| Bigeye | Enterprises tying data to AI | Proprietary | None mentioned | Not published; demo |
| Sifflet | Teams on Snowflake or Databricks | Proprietary SaaS | "Start for Free Now" button; trial terms not stated | Not published; plans by assets |
| Acceldata | Hybrid and on-premises setups | Proprietary | 30-day trial | Not published |
| Anomalo | Private-network deployment | Proprietary | None mentioned | Not published; demo |
| Soda | Public price, code-first teams | Soda Core source-available; hosted platform | Free plan $0 (checked Oct 2026) | Team $750 a month |
| Elementary | dbt users | Open-source tool plus Cloud | Open source; 30-day trial | Cloud: "talk to us" |
| Datafold | Checking changes before release | Proprietary | None mentioned | Not published; demo |
The 9 best data observability tools
1. Monte Carlo: best for large estates with many teams
At a glance: A paid platform that monitors tables, traces problems through lineage and routes alerts.
Start with Monte Carlo's pricing page, which says every tier includes Agent Observability, ML Observability and Data Observability. Its platform page then describes monitors, anomaly detection, lineage that shows upstream dependencies and recent changes, and agents that help sort and tune alerts.
There are four tiers: Start, Scale, Enterprise and Business Critical. Start allows up to 10 users and up to 1,000 monitors. You buy credits, and the page says the cost per credit depends on the tier.
What is good
- Its platform page says the Troubleshooting Agent can "Investigate upstream dependencies and recent changes to find the likely root cause."
- The same page says the Triage Agent uses anomaly data, alert history, lineage, orchestrator signals and the business criticality of affected assets to set priorities.
- A Tuning Agent looks at a monitor's configuration, recent incidents, anomaly patterns and how your team handled past alerts, per the platform page. That targets alert noise.
- Every tier from Scale up has unlimited users, and Scale adds SSO, SCIM, PII filtering, audit logging, data exports and webhooks, per the pricing page.
- Support response times are public: a 24-hour SLA on Start, 8+ hours on Scale and 4+ hours on Enterprise.
- Integrations widen with the tier. Scale adds lakes (Databricks, Hive, Glue, Azure Data Lake) and databases (MySQL, Postgres, SQL Server), Enterprise adds Oracle, SAP Hana, Teradata and Microsoft Fabric, and Business Critical adds a dedicated instance.
Where it falls short
- No dollar figure is shown. You buy credits, and the pricing page says the "Cost per credit depends on the tier", with a "Request pricing" button.
- Reviewers on AWS Marketplace call the credit billing hard to predict (quoted below).
- Start is capped at up to 10 users, pay per monitor up to 1,000, and 10,000 API calls a day. Scale allows 50,000 and Enterprise 100,000.
- SSO, SCIM, audit logging, PII filtering, data exports and webhooks are listed from Scale, not Start.
- Lake and database sources (including MySQL, Postgres and SQL Server) are listed as additional integrations from Scale. Start lists data warehouse, BI and ETL.
- The pricing page doesn't mention a free trial. It's proprietary, with no open-source edition or self-hosted download on the pages we read ("Self-Hosted Storage" is listed under Scale's Advanced Security).
Pick something else if you're a small team. Metaplane Free or Soda Free cost $0 (checked Oct 2026).
What users say: G2 reviewers, shown on AWS Marketplace, praise it as "a very hands-off platform" (August 2026) but say its "billing/credit logic is extremely complicated to understand and predict" (September 2026).
2. Metaplane by Datadog: best for small teams starting out
At a glance: A hosted tool that lists machine learning monitors and a Free plan at $0, per its pricing page (checked Oct 2026).
Metaplane calls itself "an end-to-end data observability platform". It lists monitors, column-level lineage, alerts and checks that run on their own when someone changes code. Its integrations include Snowflake, BigQuery, Redshift, Databricks, dbt, Airflow, PostgreSQL, MySQL and SQL Server.
Then came the big news: Datadog announced the acquisition on 2025-04-23 and said Metaplane would keep serving customers as Metaplane by Datadog. No timeline was given for merging the two products. Datadog's own Data Observability docs list a catalog, lineage, quality monitoring, jobs monitoring and code-change checks.
On the pricing page, Free is $0 (10 monitored tables, 4 users), Pro is pay per monitored table, and Enterprise is custom (checked Oct 2026).
What is good
- Free is "Free forever" with 10 monitored tables and 4 users, and the pricing page says "no credit card required". It also says to choose a plan "after 14 days".
- Free includes seven monitor types: volume, schema, freshness, uniqueness, nullness, statistical distribution and custom SQL monitors. Alerts go to Slack, email and Microsoft Teams.
- Pro (pay per monitored table, 12 users, unlimited viewers) adds column-level lineage, data CI/CD, cost and performance monitoring and data insights.
- Snowflake users can pay with their existing Snowflake credits, per the pricing page.
- Enterprise adds custom integrations, SSO (Okta, AD, SAML) and AWS or Azure PrivateLink, and the pricing page lists SOC 2, GDPR and HIPAA under security.
- The homepage lists Snowflake, BigQuery, Redshift, Databricks, ClickHouse and S3, plus Airbyte, Fivetran, dbt, Airflow and BI tools such as Looker and Tableau.
Where it falls short
- The price per monitored table isn't shown for Pro or Enterprise.
- Free stops at 10 tables and 4 users, and its support row says email support. Premium support, a shared Slack channel and a CSM are listed for Enterprise.
- Partition monitors and rolling window monitors are listed on the paid plans, not on Free.
- Data Impact Previews, Data Test Previews and Credit and Spend Monitoring are marked "Add-On" on the paid plans.
- Custom integrations, SSO and PrivateLink are Enterprise only.
- Datadog's announcement gave no timeline for merging the products, so the roadmap now lives inside a bigger company.
Pick something else if you want a vendor with no parent company. Soda and Elementary are independent products.
3. Bigeye: best for enterprises linking data checks to AI use
At a glance: A paid platform that has grown from data monitoring into AI trust and access control.
Bigeye describes itself as "The Enterprise AI Trust Platform". Its homepage lists data observability with anomaly detection, lineage, sensitive data scanning, metadata management, governance and cost anomaly detection.
The homepage offers a demo, a product tour and a monthly webinar. No price is shown, and the /pricing address returned a "not found" error when we checked in October 2026 (so no luck there). Its blog has 2026 posts on AI Guardian, a Model Context Protocol (MCP) server, which lets AI tools call a product and AI cost anomaly detection.
What is good
- Its homepage lists seven modules: Metadata Management, Data Lineage, Data Observability, Data Sensitivity, Data Governance, AI Guardian and Agent Trust Hub.
- It says it can "Automatically find hidden PII, PHI, PCI, and other sensitive data".
- It describes lineage as end-to-end, with connectivity for "both modern and legacy data stacks" (its claim, untested by us).
- It lists runtime enforcement of data access policies, so AI applications only use data you trust.
- Cost anomaly detection is on the feature list, and its blog mentions a Databricks connector for Agent Trust Hub.
- A self-guided product tour and a monthly demo webinar are offered, so you can look before talking to sales.
Where it falls short
- No price is shown, and the /pricing address returned a "not found" error when we checked in October 2026.
- No free plan or trial is shown. The offers are a demo, a product tour and a webinar.
- Deployment options aren't stated on the homepage.
- The homepage doesn't state Apache Iceberg support or give a count of supported platforms.
- Data observability is one of seven modules, and the homepage leads with AI trust, which may be more than you need for table alerts.
- Posts on the blog page carry no dates, so we can't judge how often it ships.
Pick something else if you only want table alerts. Metaplane or Soda are narrower and cheaper to start.
4. Sifflet: best for teams on Snowflake or Databricks
At a glance: A platform that bundles observability, a catalog and lineage, billed by number of assets.
Sifflet calls itself "The Control Plane for Data and AI". Its homepage names Amazon Redshift, Databricks, BigQuery and Snowflake, and has a "Start for Free Now" button and a demo option, with no trial terms stated.
The pricing page sorts plans by assets monitored: Entry up to 500, Growth up to 1,000 and Enterprise above 1,000. No dollar figure appears, and the page sends you to a contact form. One extra detail: it says Snowflake credits can be used with Sifflet.
What is good
- Plans hang on one number, assets monitored: Entry up to 500, Growth up to 1,000 and Enterprise 1,000+, per the pricing page.
- Entry is self-serve or through marketplaces, Growth is sales-assisted or marketplaces, and Enterprise is direct or through a channel.
- Under "What you'll get" the page lists core data observability and catalog (freshness, schema, volume, custom metrics), lineage and impact analysis, and automated root-cause analysis.
- Its homepage says Sifflet enriches every issue with lineage, downstream usage and ownership.
- Enterprise supports SaaS, hybrid or self-hosted deployment, with 24/7 white-glove support and an onboarding program that includes executive sponsorship.
- The page says "Got Snowflake credits sitting around? You can use them here."
Where it falls short
- No dollar amounts are published, and the page sends you to a contact form.
- Hybrid and self-hosted deployment appear only under Enterprise. Entry and Growth list SaaS.
- Entry gets standard support and guided onboarding, and Growth gets priority support. The 24/7 tier is Enterprise.
- The Sage (issue diagnostic) and Forge (fix suggestions) agents are listed as "Early Access to Upcoming" agents.
- The homepage has a "Start for Free Now" button but states no trial terms, and doesn't say "free trial".
- The page doesn't define what counts as one asset in the text we read, so ask before you compare it with a per-table price. The homepage names four platforms (Redshift, Databricks, BigQuery, Snowflake) and doesn't state Iceberg support.
Pick something else if you want a price up front. Soda lists $750 a month (checked Oct 2026).
What users say: G2 reviewers, shown on AWS Marketplace, like that "we only get alerts if the data behaves differently than it did in the past" (January 2026) but report "Some false positives and too many alerts" (May 2026).
5. Acceldata: best for hybrid and on-premises setups
At a glance: A platform that watches data quality and also keeps an eye on cloud data costs.
Acceldata calls itself "The Autonomous Platform for Data and Agentic AI". Its homepage says it runs "on-prem, in the cloud, in hybrid environments, or on Kubernetes".
The pricing page has two product lines, Data Reliability and Cost Optimization, each with a Pro and an Enterprise tier.
The page also advertises a 30-day free trial, and the Cost Optimization Pro tier has a Start Free Trial button. Data Reliability Pro and both Enterprise tiers say to contact sales. No dollar amount is shown anywhere (checked Oct 2026).
What is good
- The homepage says it runs "on-prem, in the cloud, in hybrid environments, or on Kubernetes".
- Data Reliability Pro lists anomaly detection, profiling, freshness, schema drift, automated data classification, out-of-the-box data quality rules and policies, and monitors and alerts, per the pricing page.
- A 30-day free trial is advertised on the pricing page, and Cost Optimization Pro has a Start Free Trial button.
- Cost Optimization Pro lists cost metrics and trends, Query Studio, dashboards, and alerts and monitors. Its Enterprise tier adds automated actions, chargeback and showback.
- Its site menu describes Hadoop Observability as seeing "clusters, jobs, queues, users, and cost in one place", which matters if you still run Hadoop.
- Its menu has a "By Data Platform" list: Snowflake, Databricks, AWS, Hadoop, GCP and Azure.
Where it falls short
- No dollar amount is shown anywhere on the pricing page.
- Data Reliability Pro and both Enterprise tiers say Contact Sales. Only Cost Optimization Pro has a Start Free Trial button.
- Reconciliation, RBAC and enterprise readiness, pipeline monitoring, an SDK, reporting, domain specific rules and advanced classification sit in Data Reliability Enterprise.
- In Cost Optimization, automated actions, chargeback, showback, training and advanced support are Enterprise features.
- The homepage puts "agentic" AI first, and its menu lists data warehousing, an agentic runtime and Hadoop modernization beside observability. Ask to see the basic table checks in a demo.
- A connector list and Iceberg support aren't stated on the pages we read.
Pick something else if you run only in the cloud and want a quick start. Metaplane has a free plan.
What users say: G2 reviewers, shown on AWS Marketplace, call pipeline observability "the best part of it" (March 2026) but say "Deployment of Acceldata is time consuming, with extensive prior planning" (June 2026).
6. Anomalo: best for keeping monitoring inside your own network
At a glance: A monitoring product that can run inside your own private cloud network or as a hosted service. A virtual private cloud (VPC) is a private network inside a cloud account, and the page says it works "fully in your VPC or as SaaS".
Anomalo's homepage calls the product "the autonomous data system for the agentic enterprise" and lists agents for data quality monitoring, table observability and documentation.
The page points you to "Get a demo" and shows no price. It doesn't name the supported data platforms in its text, and Apache Iceberg isn't mentioned.
What is good
- The homepage says it works "fully in your VPC or as SaaS", that you can bring your own model, and that your data never has to leave your environment (its claim; we didn't test it).
- It lists SOC 2 Type II, GDPR and HIPAA compliance, and SAML-based SSO with Okta, Google and Microsoft Entra ID.
- A Table Observability Agent covers data availability, freshness and schema consistency.
- A Data Quality Agent lets you define what good data looks like in natural language and monitors for deviations.
- A First Responder Agent follows runbooks, can start workflows in ServiceNow and JIRA, and escalates to people.
- A Documentation Agent pulls in catalog metadata, existing documentation and chat conversations to describe a data set.
Where it falls short
- No price, free plan or trial is shown. The page points to "Get a demo".
- Supported platforms aren't named in the page text. It speaks of "on-premises and cloud data platforms".
- Apache Iceberg isn't mentioned on the page.
- The page lists first responder, documentation and KPI monitoring agents beside table monitoring, so ask in a demo which parts you would actually use.
Pick something else if you'd like to read the docs before any sales call. Soda and Elementary publish theirs.
7. Soda: best when you want a public price and code-first checks
At a glance: A data quality platform with an engine you can read and a hosted product that includes observability.
Soda's pricing page shows its prices. Free is $0 a month, Team is $750 a month, which is $9,000 a year before extra SPUs, and Enterprise is custom (checked Oct 2026). The Free plan needs no credit card and covers pipeline testing, metrics observability and alerting.
It also comes with some Soda Processing Units (SPUs), the meter for extra usage, while Team adds pay as you go for more. The price of one of those units isn't shown, so that's the number to ask about.
Soda Core is the engine that runs checks written in YAML (a simple text format). Here's the catch: Soda's docs say Soda Core has no observability features by itself. Those come from the hosted product.
Its licence file is the Elastic License 2.0, which isn't a standard open-source licence.
What is good
- Free is $0 with no credit card, and covers some free Soda Processing Units, pipeline testing, metrics observability and alerting and ticketing integrations, per the pricing page (checked Oct 2026).
- Team is $750 a month with all Free features, unlimited users, pay as you go for extra SPUs and catalog integrations (checked Oct 2026).
- The docs list three deployment models: Soda Core, a Soda-hosted Runner, and a Self-hosted Runner that runs in your own Kubernetes environment.
- The docs list warehouses and databases (Databricks, Snowflake, BigQuery, Redshift, PostgreSQL, MySQL, Spark, Presto, DuckDB), orchestrators (Airflow, Dagster, Prefect, Azure Data Factory) and alert channels (Slack, Microsoft Teams, Jira, PagerDuty, ServiceNow, Opsgenie).
- The docs split testing, which validates known expectations during development, from observability, which watches production, and say the two work best together.
- The Soda Core repository says Soda Core runs checks on PostgreSQL, Snowflake, BigQuery, Databricks, DuckDB and more, and shows about 2.4k stars.
Where it falls short
- Soda Core alone doesn't monitor production tables. The docs list "No observability features" for it.
- Observability needs the Soda-hosted or Self-hosted Runner, and the docs say those runners cannot scan in-memory sources like Spark or DataFrames.
- The Self-hosted Runner lists "Kubernetes expertise required".
- Collaborative data contracts, the no-code interface, advanced AI-powered features, audit logs, custom roles, RBAC, private deployment, SSO and premium support appear under Enterprise on the live page, not Team.
- The price of one SPU isn't shown, so Team's pay-as-you-go cost can't be worked out from the page.
- Soda Core's licence is the Elastic License 2.0, which GitHub reports as "Other", so read it before you build a product on Soda Core.
Pick something else if you want machine learning monitors. Metaplane lists them, but ask how much setup they need.
What users say: The Data Letter's Soda Core versus Great Expectations review (October 2025) says anyone who can write a simple SQL filter can "start writing Soda checks in minutes" but calls it "Powerful, but primarily within a declarative framework."
8. Elementary: best for teams that already use dbt
At a glance: An open-source command line tool and dbt package that add monitoring and alerts to a dbt project you already have.
First, a quick definition: dbt is a tool that transforms warehouse data with SQL. Elementary's repository calls its open-source tool "the open-source CLI for dbt-native data observability". Anomaly detection tests run like any other dbt test, and alerts go to Slack and Microsoft Teams. The docs list 14 adapters (the connectors to each warehouse), including Snowflake, BigQuery, Redshift, Databricks and PostgreSQL.
Its licence is Apache 2.0, and the latest release, v0.26.0, came out on 2026-09-10.
Per the docs, the free tool covers a single dbt project. Got several projects, or a warehouse but no dbt? Look at Elementary Cloud.
On the Cloud pricing page, the plans are Scale (up to 10 editor seats and 1K tables), Enterprise (up to 20 editor seats, 40 viewer seats and 3K tables) and Unlimited. The page says pricing is based on seats and environments. All three plans read "Talk to us", and a 30-day free trial is listed (checked Oct 2026).
What is good
- Anomaly detection tests run as native dbt tests, and Elementary's configuration lives in your dbt code, per the README.
- Alerts go to Slack and Microsoft Teams, with custom channels and tagging of owners, per the README.
- The docs list adapters beyond the big warehouses, including Athena, ClickHouse, Trino, DuckDB, Dremio, Spark, Fabric, SQL Server and Vertica.
- The Cloud pricing page lists automated monitors, anomaly detection, column-level lineage, performance monitoring, data tests, BI integrations, incident management, an MCP server and data health scores from the Scale plan.
- The page says Elementary is SOC-2 type II certified and that Cloud can't access your data. The 30-day free trial has no limits on seats, environments or monitored tables.
- On leaving, its FAQ says "You can always stop using Elementary and use our self-hosted community version."
Where it falls short
- The free tool needs dbt. It reads the metadata and test results the Elementary dbt package collects, so no dbt means Elementary Cloud.
- The free tool covers one dbt project. More projects, or a warehouse without dbt, need Cloud.
- Cloud prices aren't published. All three plans read "Talk to us", extra tables are priced at "$ per extra 1K" with no figure, and the FAQ answer on getting a price without a call asks for a conversation.
- Table allowances are fixed per plan: 1K on Scale and 3K on Enterprise and Unlimited, with seat caps of 10 editors on Scale and 20 editors plus 40 viewers on Enterprise.
- SSO, RBAC and advanced deployment options start at Enterprise. A dedicated customer success engineer and external catalog integrations start at Unlimited.
- AI agents carry additional credit-based pricing on top of the plan.
Pick something else if you don't use dbt and want a free tool. Soda or Metaplane work without it.
9. Datafold: best for checking changes before they ship
At a glance: A platform known for Data Diff, which compares two versions of a dataset, value by value.
Datafold's homepage describes Data Diff as comparing datasets within or across databases "with value-level precision". It also lists migration tooling, a knowledge graph and ML-driven anomaly detection. In plain terms, it answers did my code change alter the data? more than is the table healthy today? Different question, different tool.
The pricing page address redirects to a contact page, which we confirmed in October 2026. The main call to action is "Request a Demo", and no price is published.
What is good
- Its homepage describes Data Diff as comparing datasets within or across databases "with value-level precision at any scale".
- It says Datafold can be deployed in your Virtual Private Cloud inside AWS, GCP or Azure, so data stays in your security perimeter.
- Its menu lists GDPR, HIPAA and SOC 2 compliance.
- For platform migrations it says "guaranteed price, timeline and quality", with pricing based on the number of objects (its claim, untested by us).
- Data Diff and monitors are exposed via MCP so coding agents can validate their own work, per the homepage.
Where it falls short
- No price is shown. The pricing address leads to a contact page.
- The way in is a 30-minute demo request. No free plan or trial appears on the pages we read.
- Anomaly detection is one item beside Data Diff, migrations and a knowledge graph, not the main act.
- The Data Knowledge Graph is labeled Beta.
- A connector list and Iceberg support aren't stated on the homepage.
Pick something else if you want daily health alerts on lots of tables. Monte Carlo or Metaplane fit that job.
What users say: PeerSpot reviewers, on the Datafold reviews page, call it "a game changer for organizations" (August 2026) but say "the reporting capabilities are weak" (July 2026).
What these tools cost and how they bill
Ever opened an invoice and wondered how it got that big? The unit a vendor bills on shapes your bill more than the plan name does. Metaplane Pro bills per monitored table, and Sifflet sorts plans by assets.
Monte Carlo sells credits, and the cost per credit depends on the tier. Soda sells plans plus extra SPUs. Our read: that's four different yardsticks, so a plain price comparison won't work.
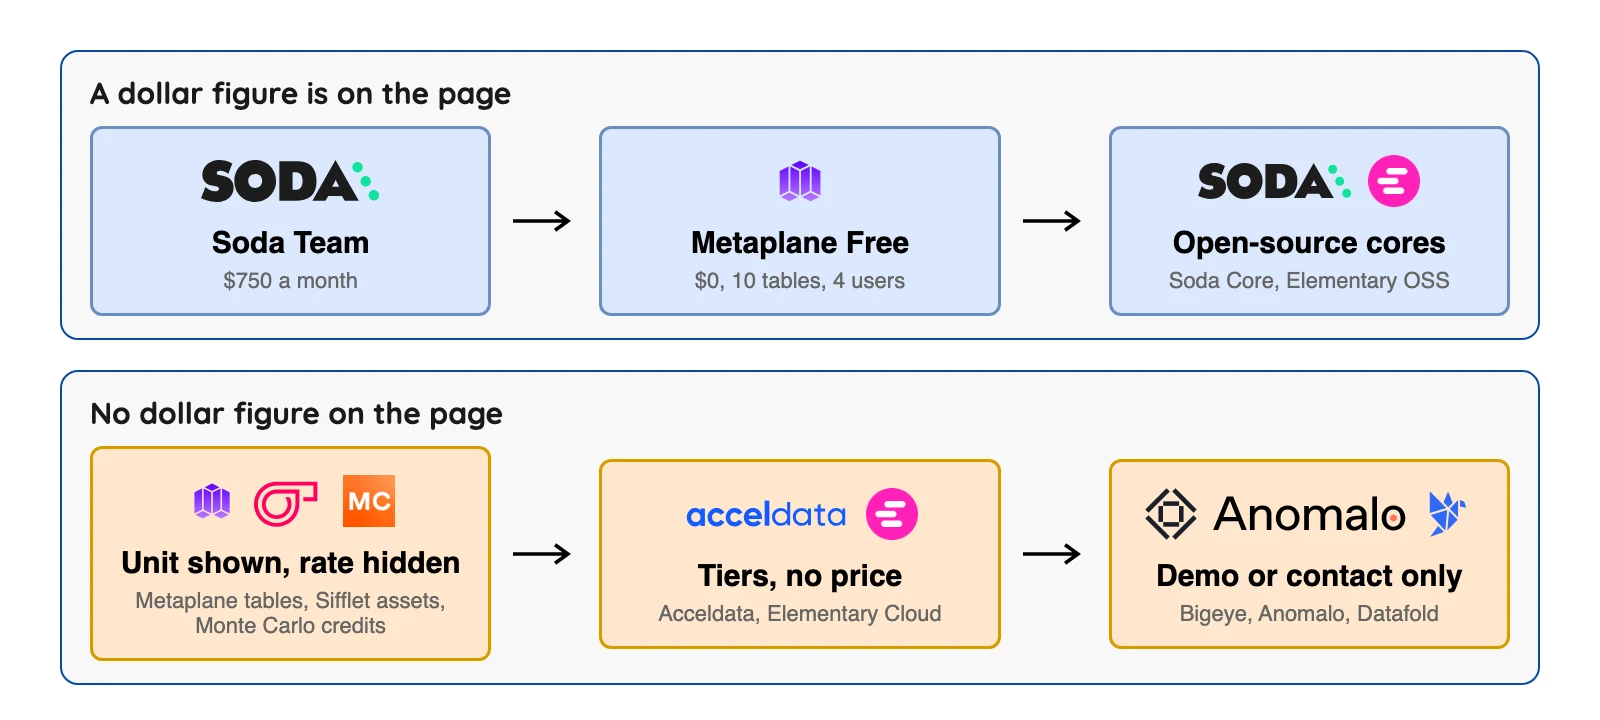
| Tool | Billing unit on its page | Dollar figure shown |
|---|---|---|
| Monte Carlo | Credits, rate depends on tier | None |
| Metaplane | Per monitored table (Pro) | Free $0 only (checked Oct 2026) |
| Sifflet | Assets monitored | None |
| Soda | Plan plus extra SPUs | Free $0, Team $750 a month (checked Oct 2026) |
| Acceldata | Tiers by product line | None |
| Elementary Cloud | Seats and environments; table allowance per plan | None |
| Bigeye, Anomalo, Datafold | Not stated | None |
Prices were read from each vendor's own page (checked Oct 2026). Many third-party lists quote monthly figures for these vendors, but we couldn't find them on the vendors' pages, so we don't repeat them.
What the community says
Honest caveat first: all of this comes from review sites and one newsletter, not from a wide survey. Review-site entries are self-selected, and some vendors invite reviews, so treat them as hints, not verdicts. These are individual opinions; one person's view, with its date and link.
| Tool | Where we found opinions | Praise and complaint, in short |
|---|---|---|
| Monte Carlo | G2 reviews, PeerSpot | Hands-off setup, but confusing credit billing |
| Sifflet | G2 reviews, PeerSpot | Fewer alerts, but some false positives |
| Acceldata | G2 reviews | Strong pipeline views, slow deployment |
| Soda | The Data Letter | Quick to start, but check-based design |
| Datafold | PeerSpot | "Game changer," but weak reporting |
How to choose in five minutes
| If this describes you | Start with | Why |
|---|---|---|
| Under 10 important tables, no budget | Metaplane Free or Soda Free | $0 plans on the vendors' pages (checked Oct 2026) |
| You already run dbt | Elementary, then Soda | Alerts reuse dbt tests |
| You want a price before a sales call | Soda Team ($750 a month (checked Oct 2026)) | The only public paid price here |
| Hundreds of tables, many teams | Monte Carlo, Bigeye or Sifflet | Built for large estates; ask for a demo |
| Data must stay in your network | Anomalo or Acceldata | Private-network or on-premises options |
| You change SQL and fear breaking data | Datafold plus a monitor | Value-level before-and-after checks |
Two more questions worth asking: can your team tune alerts, and can you export your settings if you leave? That's our advice, not a vendor rule.
And remember, free isn't really free. Self-run tools cost you time, and free hosted plans hit a wall at limits like Metaplane's 10 tables.
Want a quicker nudge? Answer five short questions and see which tools fit.
Which data observability tool fits you?
Question 1 of 5
How many tables do you need to watch?
Vendors bill by table, asset or credit, so your count shapes the bill.
How to test a tool in two weeks
A demo shows the best case. A short trial on your own tables shows the real one. These steps are our advice, not a vendor rule, and they work for any tool above.
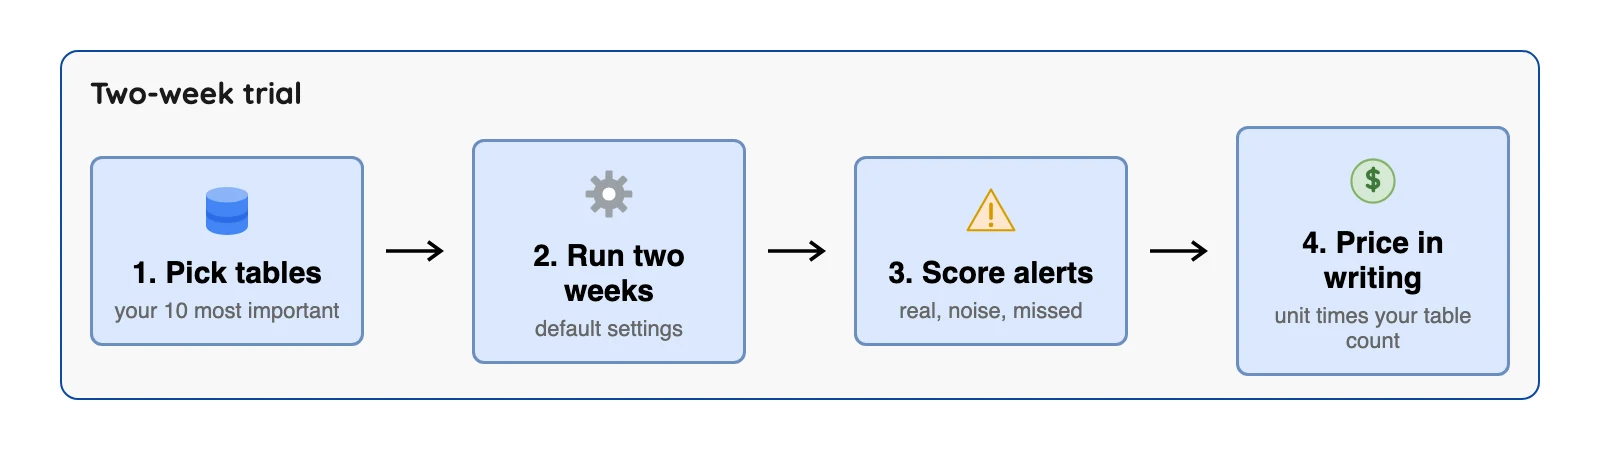
| Step | What to do | What to write down |
|---|---|---|
| Pick tables | Choose your 10 most important tables, including one that often breaks | Table names and their owners |
| Run two weeks | Keep default settings for the first week, then tune | Setup hours spent |
| Score alerts | Label each alert as real, noise or missed | Counts of each, and how long a fix took |
| Price in writing | Ask for the bill at your table or asset count | The unit, the rate and the renewal terms |
Two numbers decide most trials: how many alerts were noise, and how many real problems slipped past. Atlan's buyer guide suggests a similar proof-of-concept: measure how fast issues are found, how often alarms are false, and how long a fix takes.
A made-up example: a tool sends 20 alerts in two weeks, 5 are real and 15 are noise. That's a quarter useful. Not great, so ask the vendor how to tune it before you sign.
Where observability fits in the pipeline
Observability watches data after it lands. It doesn't move data between systems (see best data pipeline tools). If your tables come from database copies, such as Iceberg tables written by our open-source OLake Go, row counts also help compare a source with its replica.
FAQ
Q1. What are data observability tools?
Q2. What is the difference between data observability and data quality?
Q3. Which data observability tools are free?
Q4. How much do data observability tools cost?
Q5. Did Datadog buy Metaplane?
Q6. Do I need dbt to use a data observability tool?
Q7. Should a small team buy a paid platform?
Q8. Did Coalesce buy SYNQ?
Q9. How do I test a data observability tool before buying?
Conclusion
So, which one? That depends on your size and budget, and small teams can start free with Metaplane, Soda or Elementary. Large teams will shortlist Monte Carlo, Bigeye, Sifflet, Acceldata or Anomalo and should plan on a demo, since none of them publishes a price.
Before you buy, count your tables, find the unit each vendor bills on, and get the number in writing. That's the whole trick. Pricing pages change often, so confirm every figure on the vendor's page.