Configure Your First Optimization
Prerequisites
Follow the Quickstart Setup Guide to ensure the OLAKE UI is running at localhost:8000.
- You have at least one destination configured in Ingestion or
- You are ready to add a catalog manually in the optimization section.
Iceberg maintenance (Optimization) is available starting from v0.4.0. Upgrade OLake UI to access the Maintenance module.
- Existing users: If you are already using OLake for Ingestion follow the upgrade guide to accesss Maintenance module.
- New users: Follow the quickstart guide to get started.
This guide walks through configuring your first optimization for a table.
Step 1: Add a Catalog
Catalogs tell OLake where your Iceberg tables live.
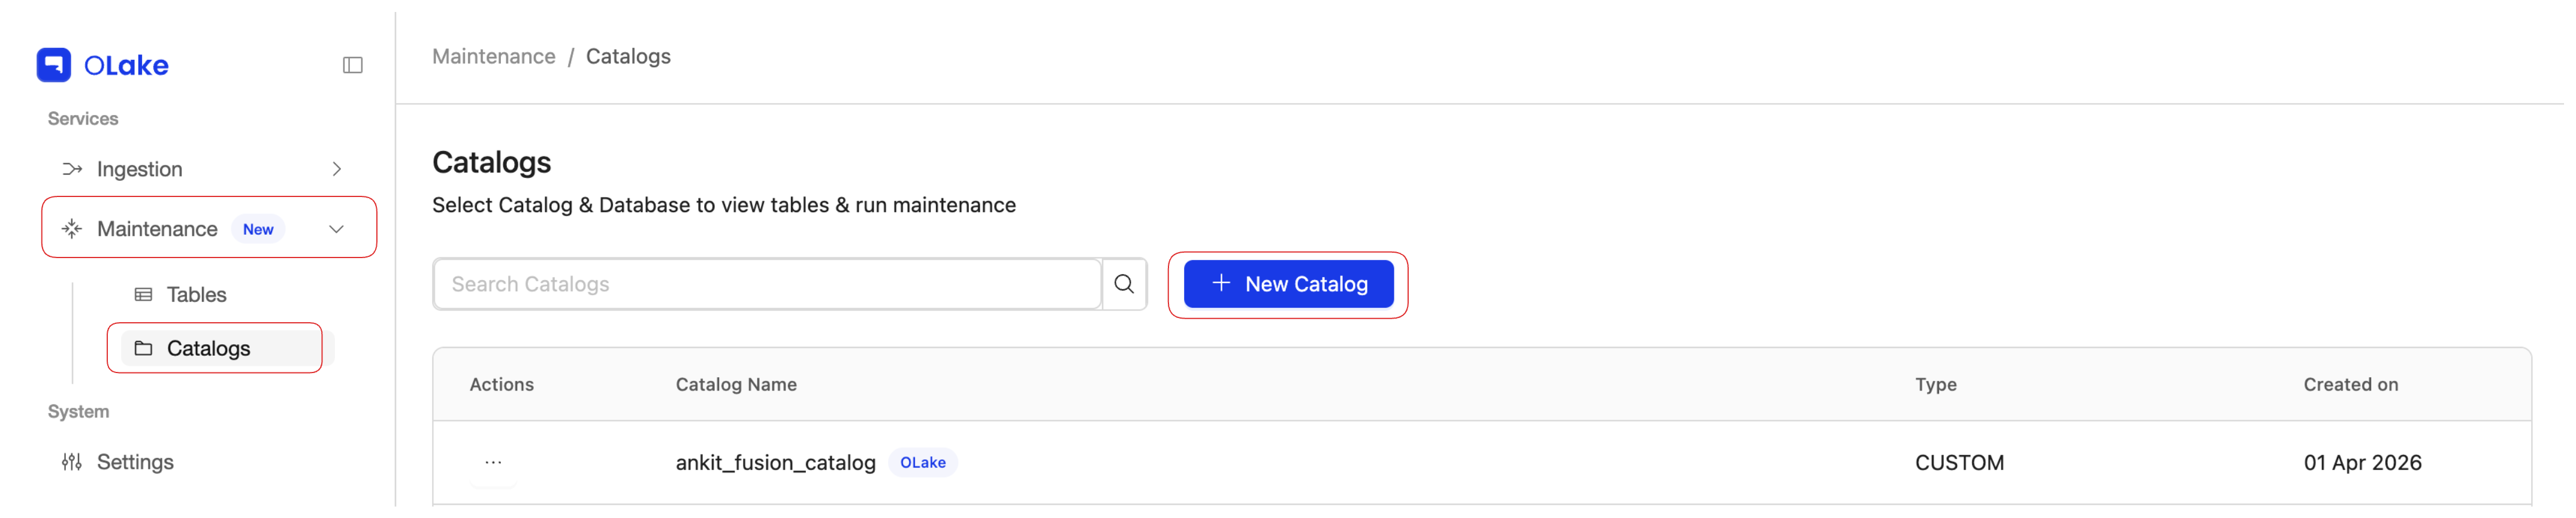
- In the OLake UI sidebar, open the Maintenance dropdown and go to the Catalogs page.
- Select New Catalog.
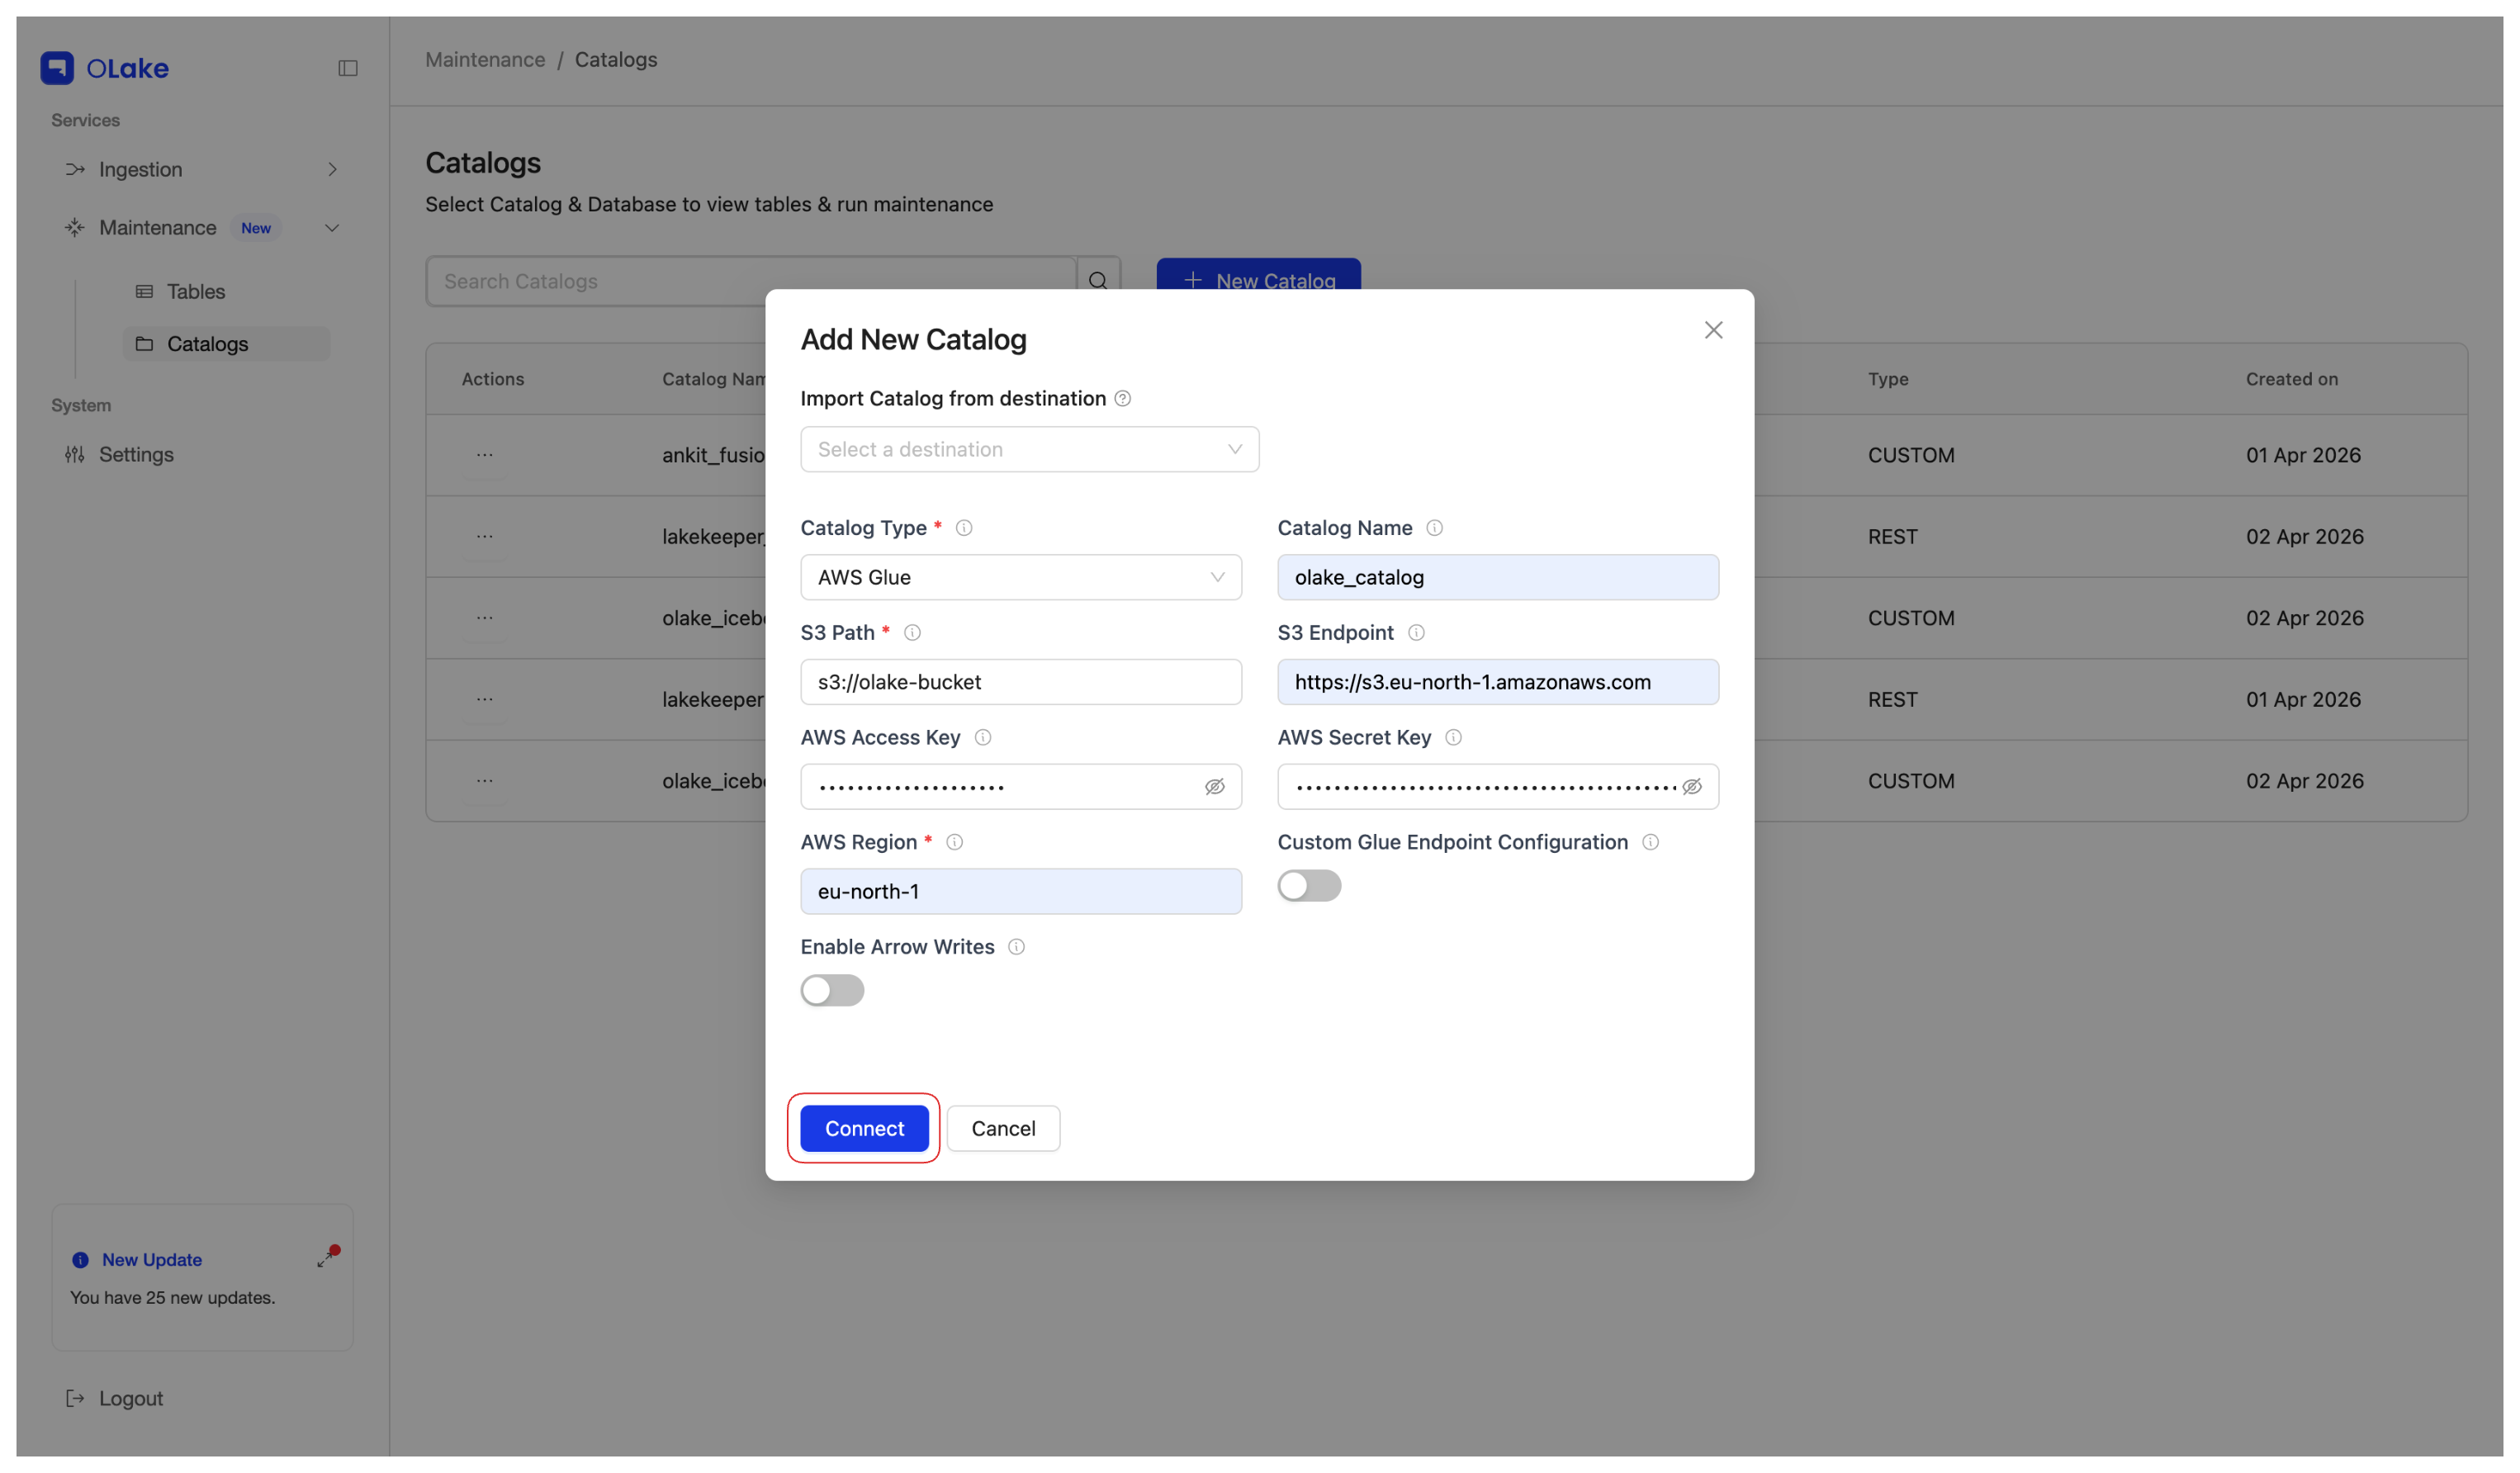
- Enter the catalog details or select a destination which you want to import credentials from in the dropdown under Import Catalog from destination
- Click on Connect to save and validate the catalog.
For more details on Catalogs, see the Catalogs documentation.
After the catalog is saved successfully, a Catalog Added Successfully modal appears with two actions:
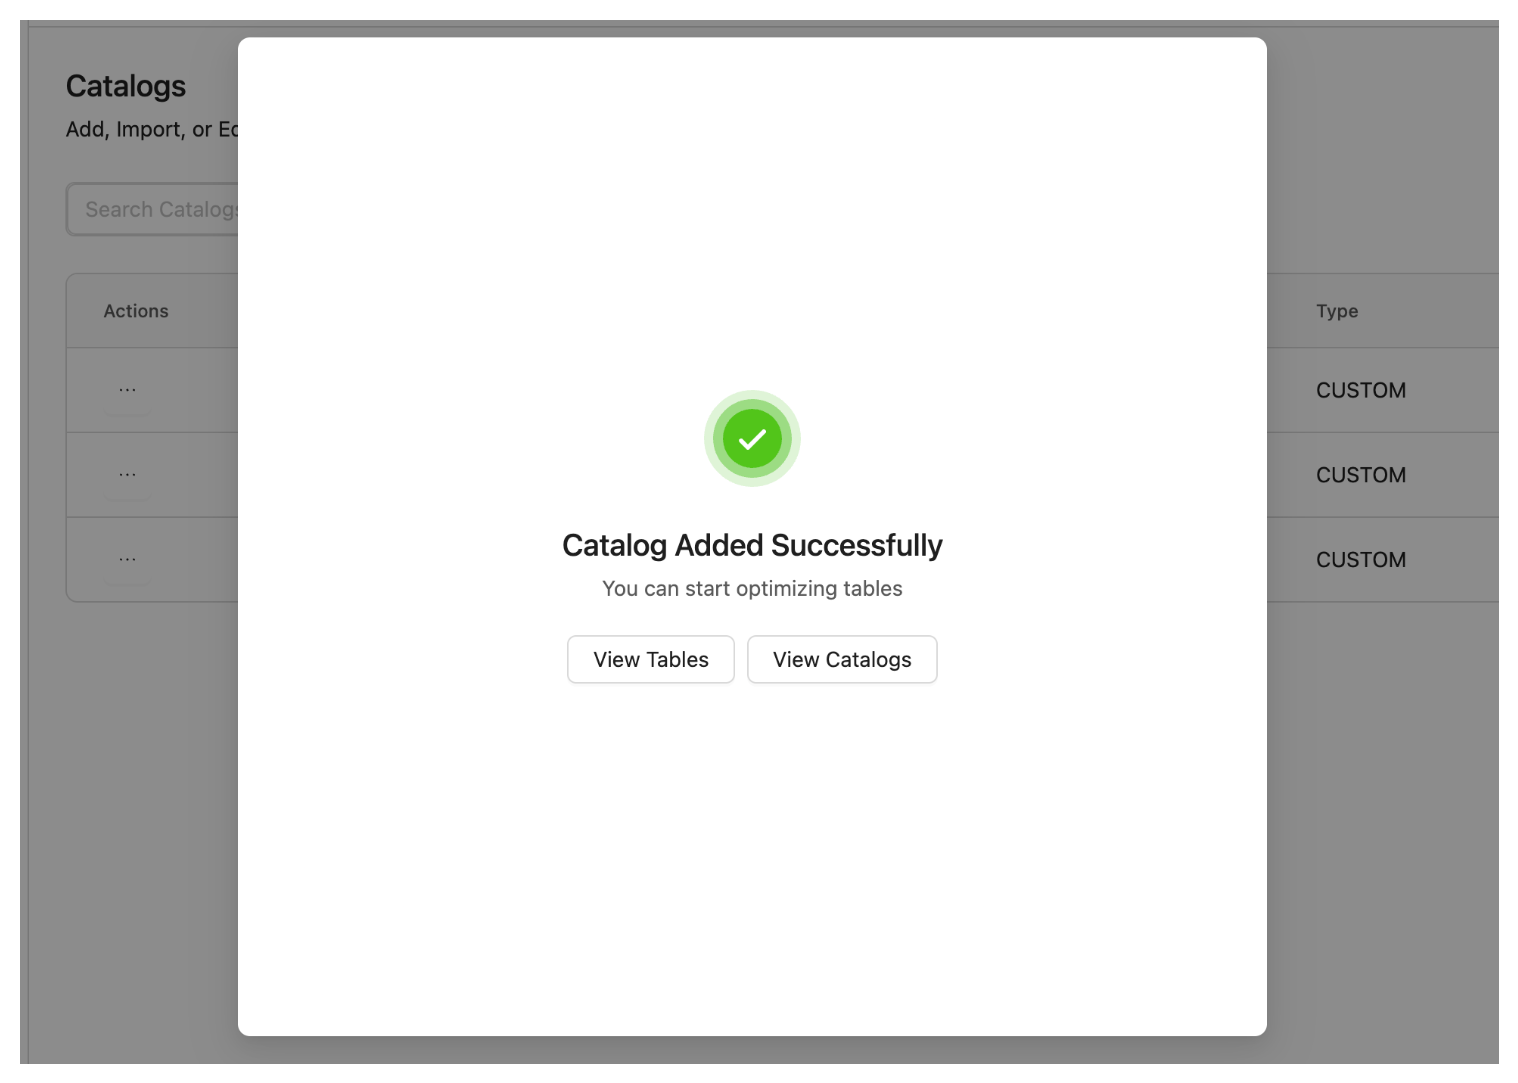
- View Tables — Opens the Tables page under Maintenance. Choose this to go straight there and continue with Step 2 below.
- View Catalogs — Stays focused on the Catalogs page under Maintenance (where you already are).
Click View Tables to go to the Tables page for Step 2.
Step 2: Select Catalog And Database
- Use the Select Catalog dropdown and select the catalog you just configured.
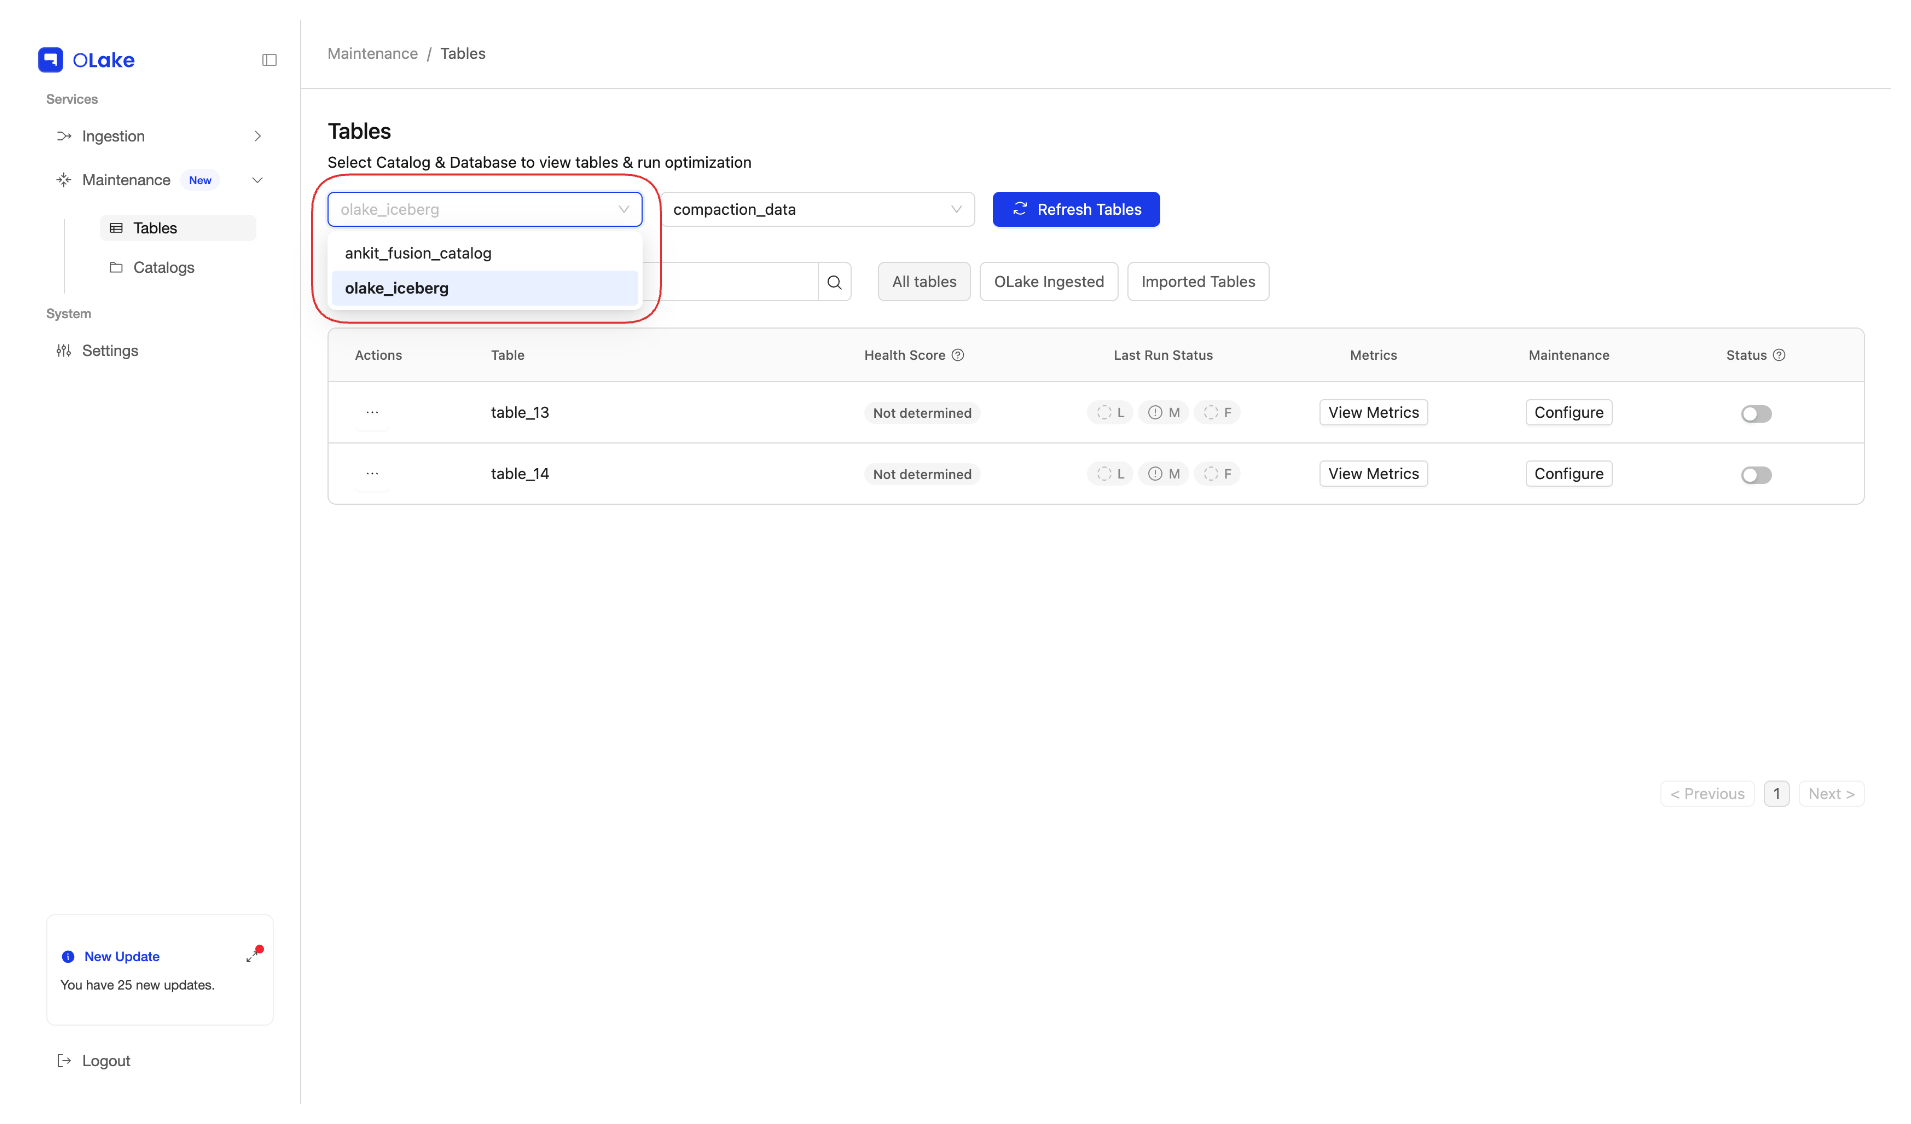
- After selecting the catalog, use the Select Database dropdown to choose a database (Iceberg DB) from that catalog.
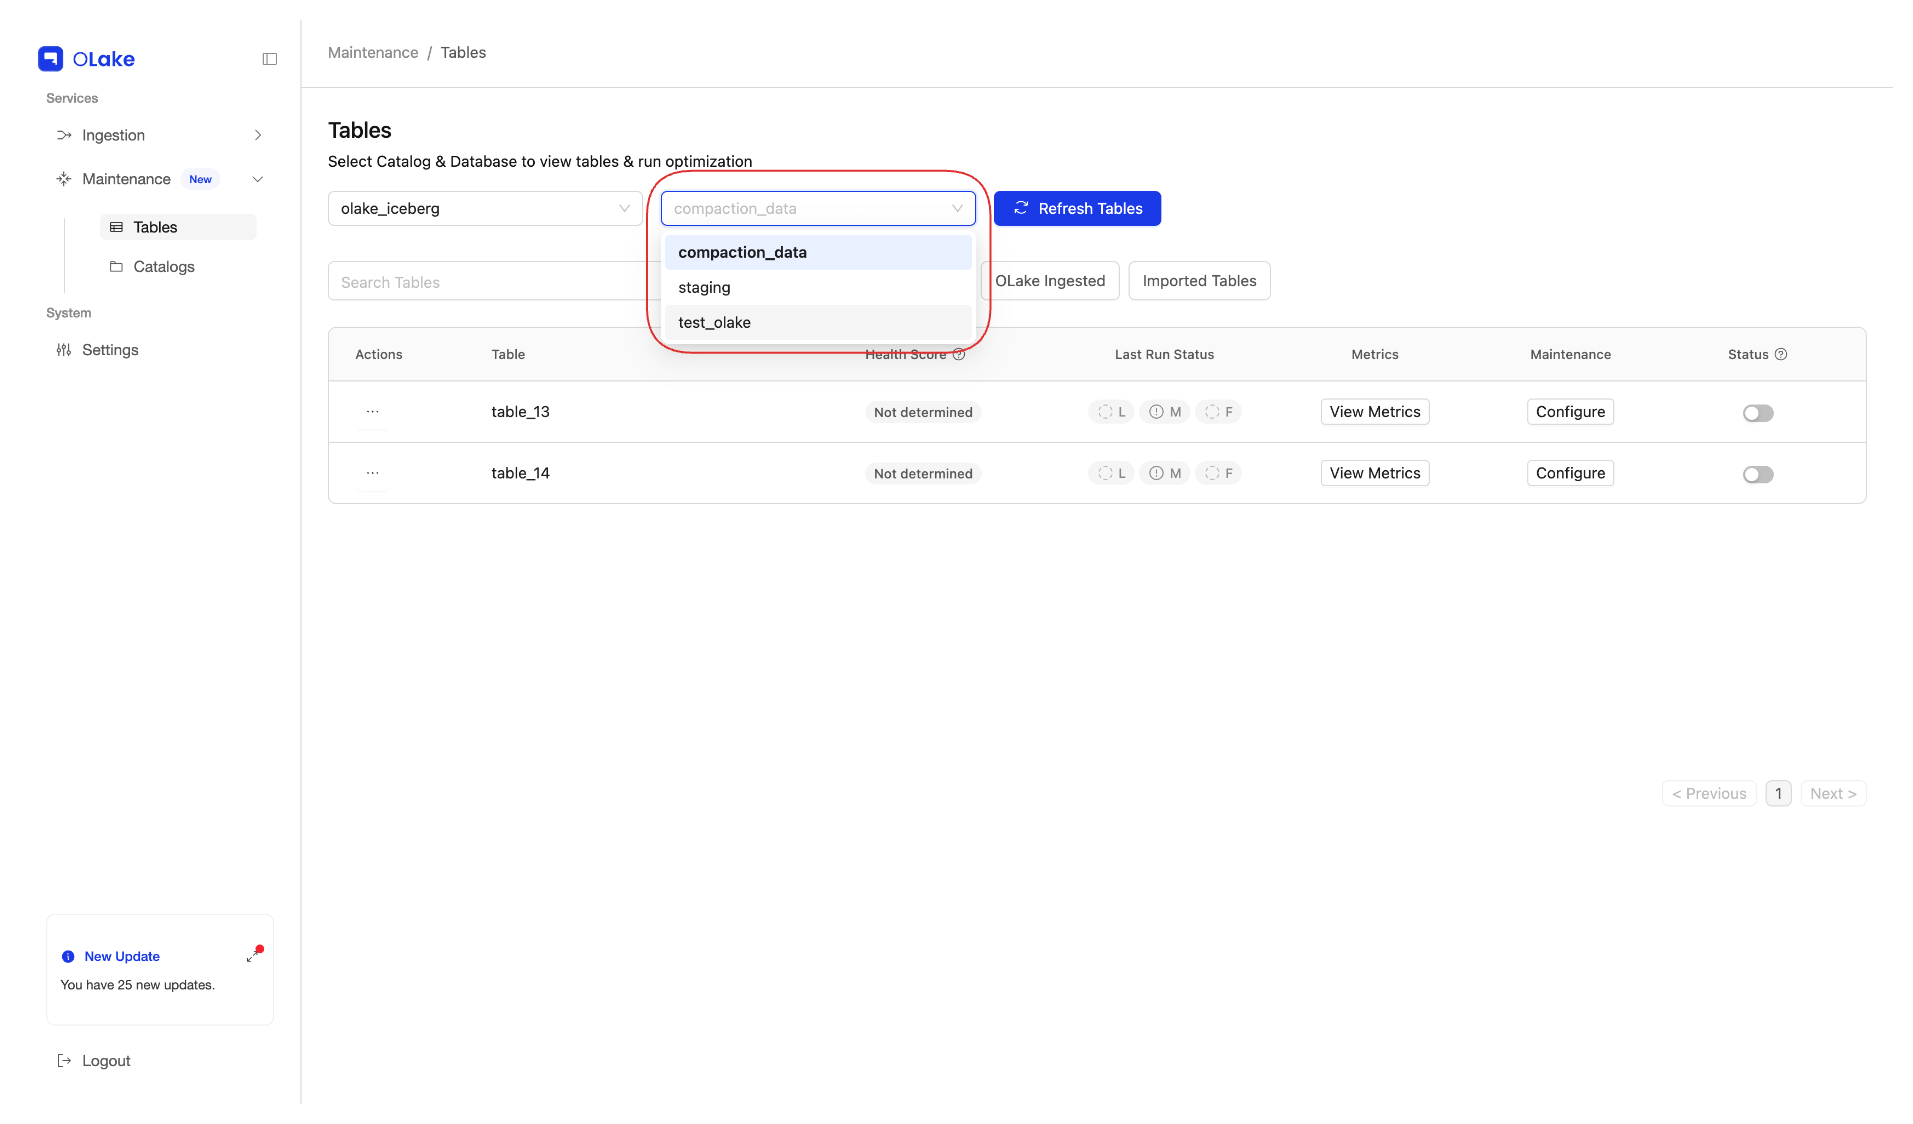
Only after you select both a catalog and a database will the list of tables in that Iceberg database appear on the page.
Step 3: Configure Optimization For Your Table
-
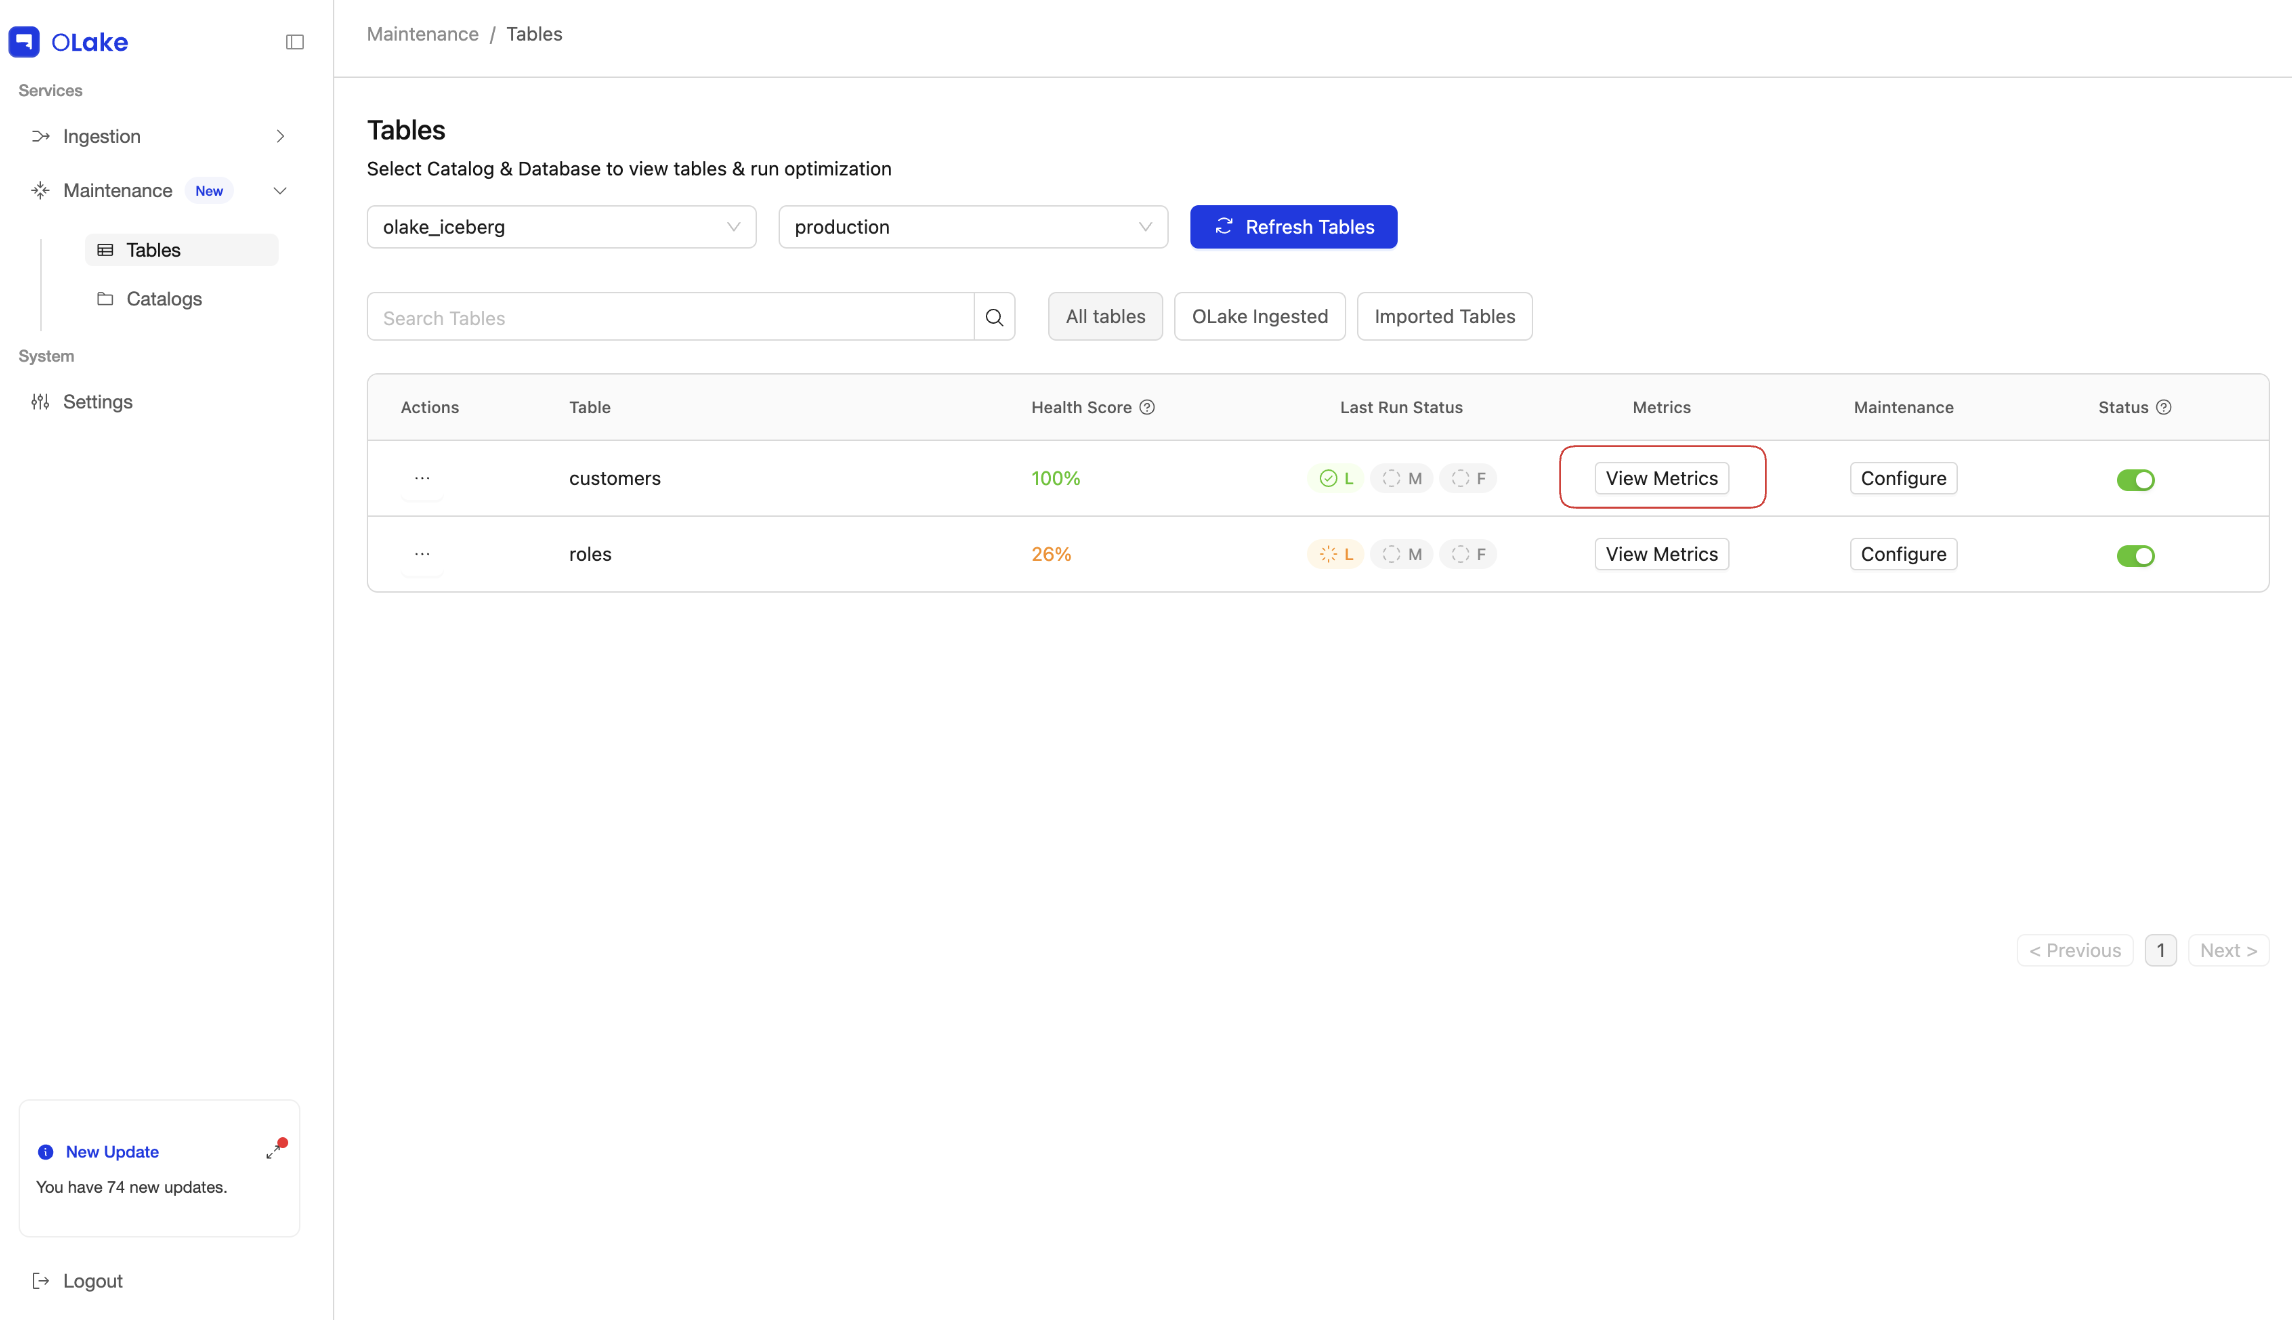
In the tables list, find the table you want to optimize.
Tip: Click View Metrics to open table metrics. Health Score and target file size (and related size signals in the metrics view) help decide whether optimization is required for that table.
-
Click on the Configure button.

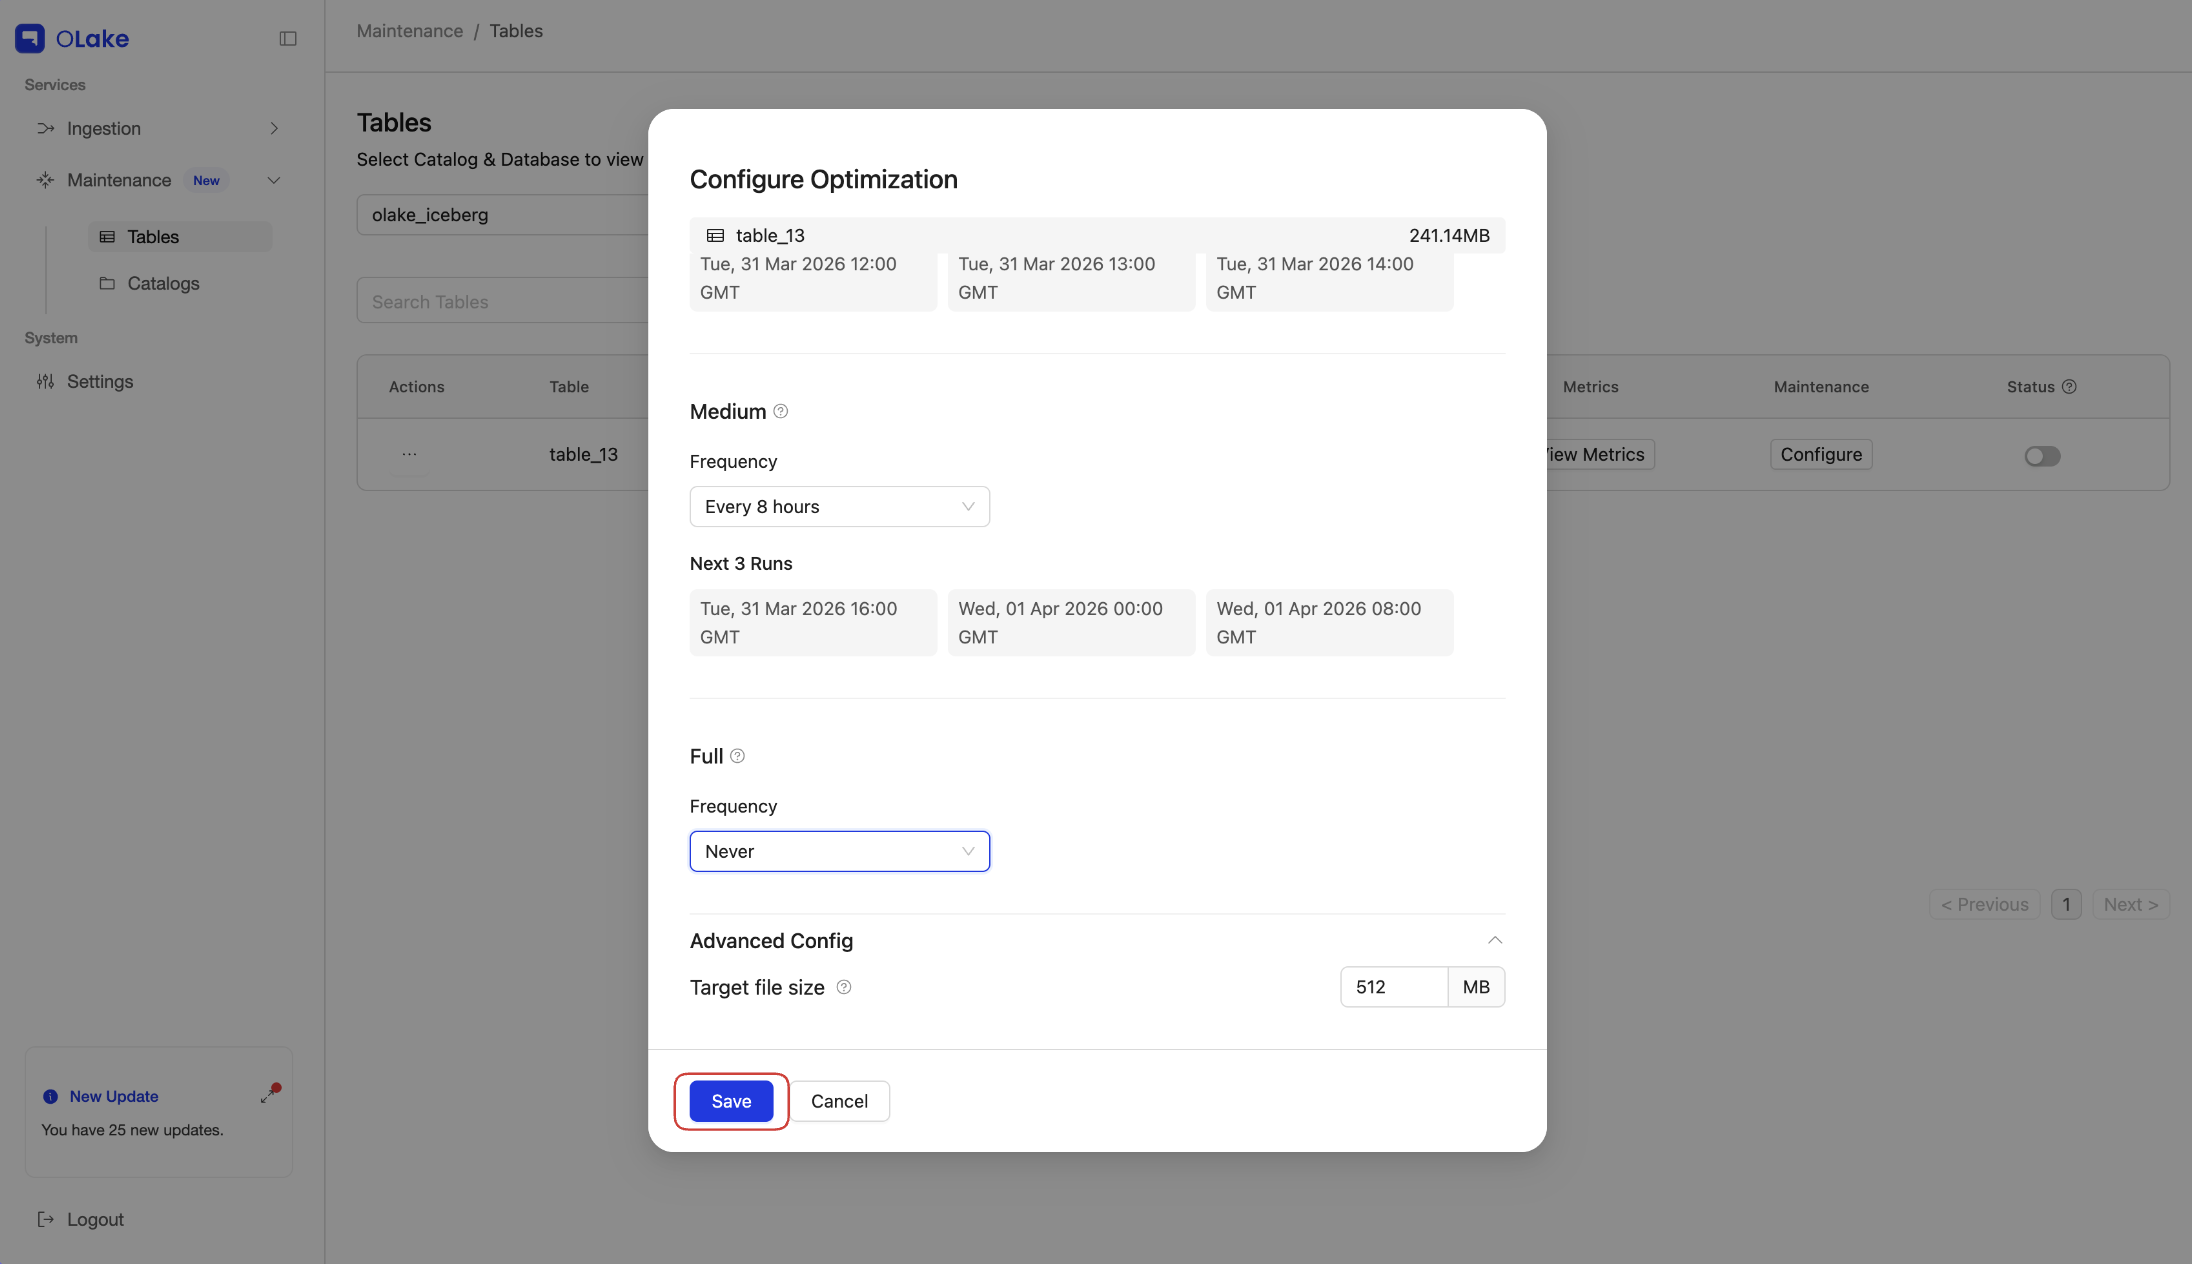
This opens a configuration modal (cron modal) where you can set schedules for Lite, Medium, and Full Optimization.
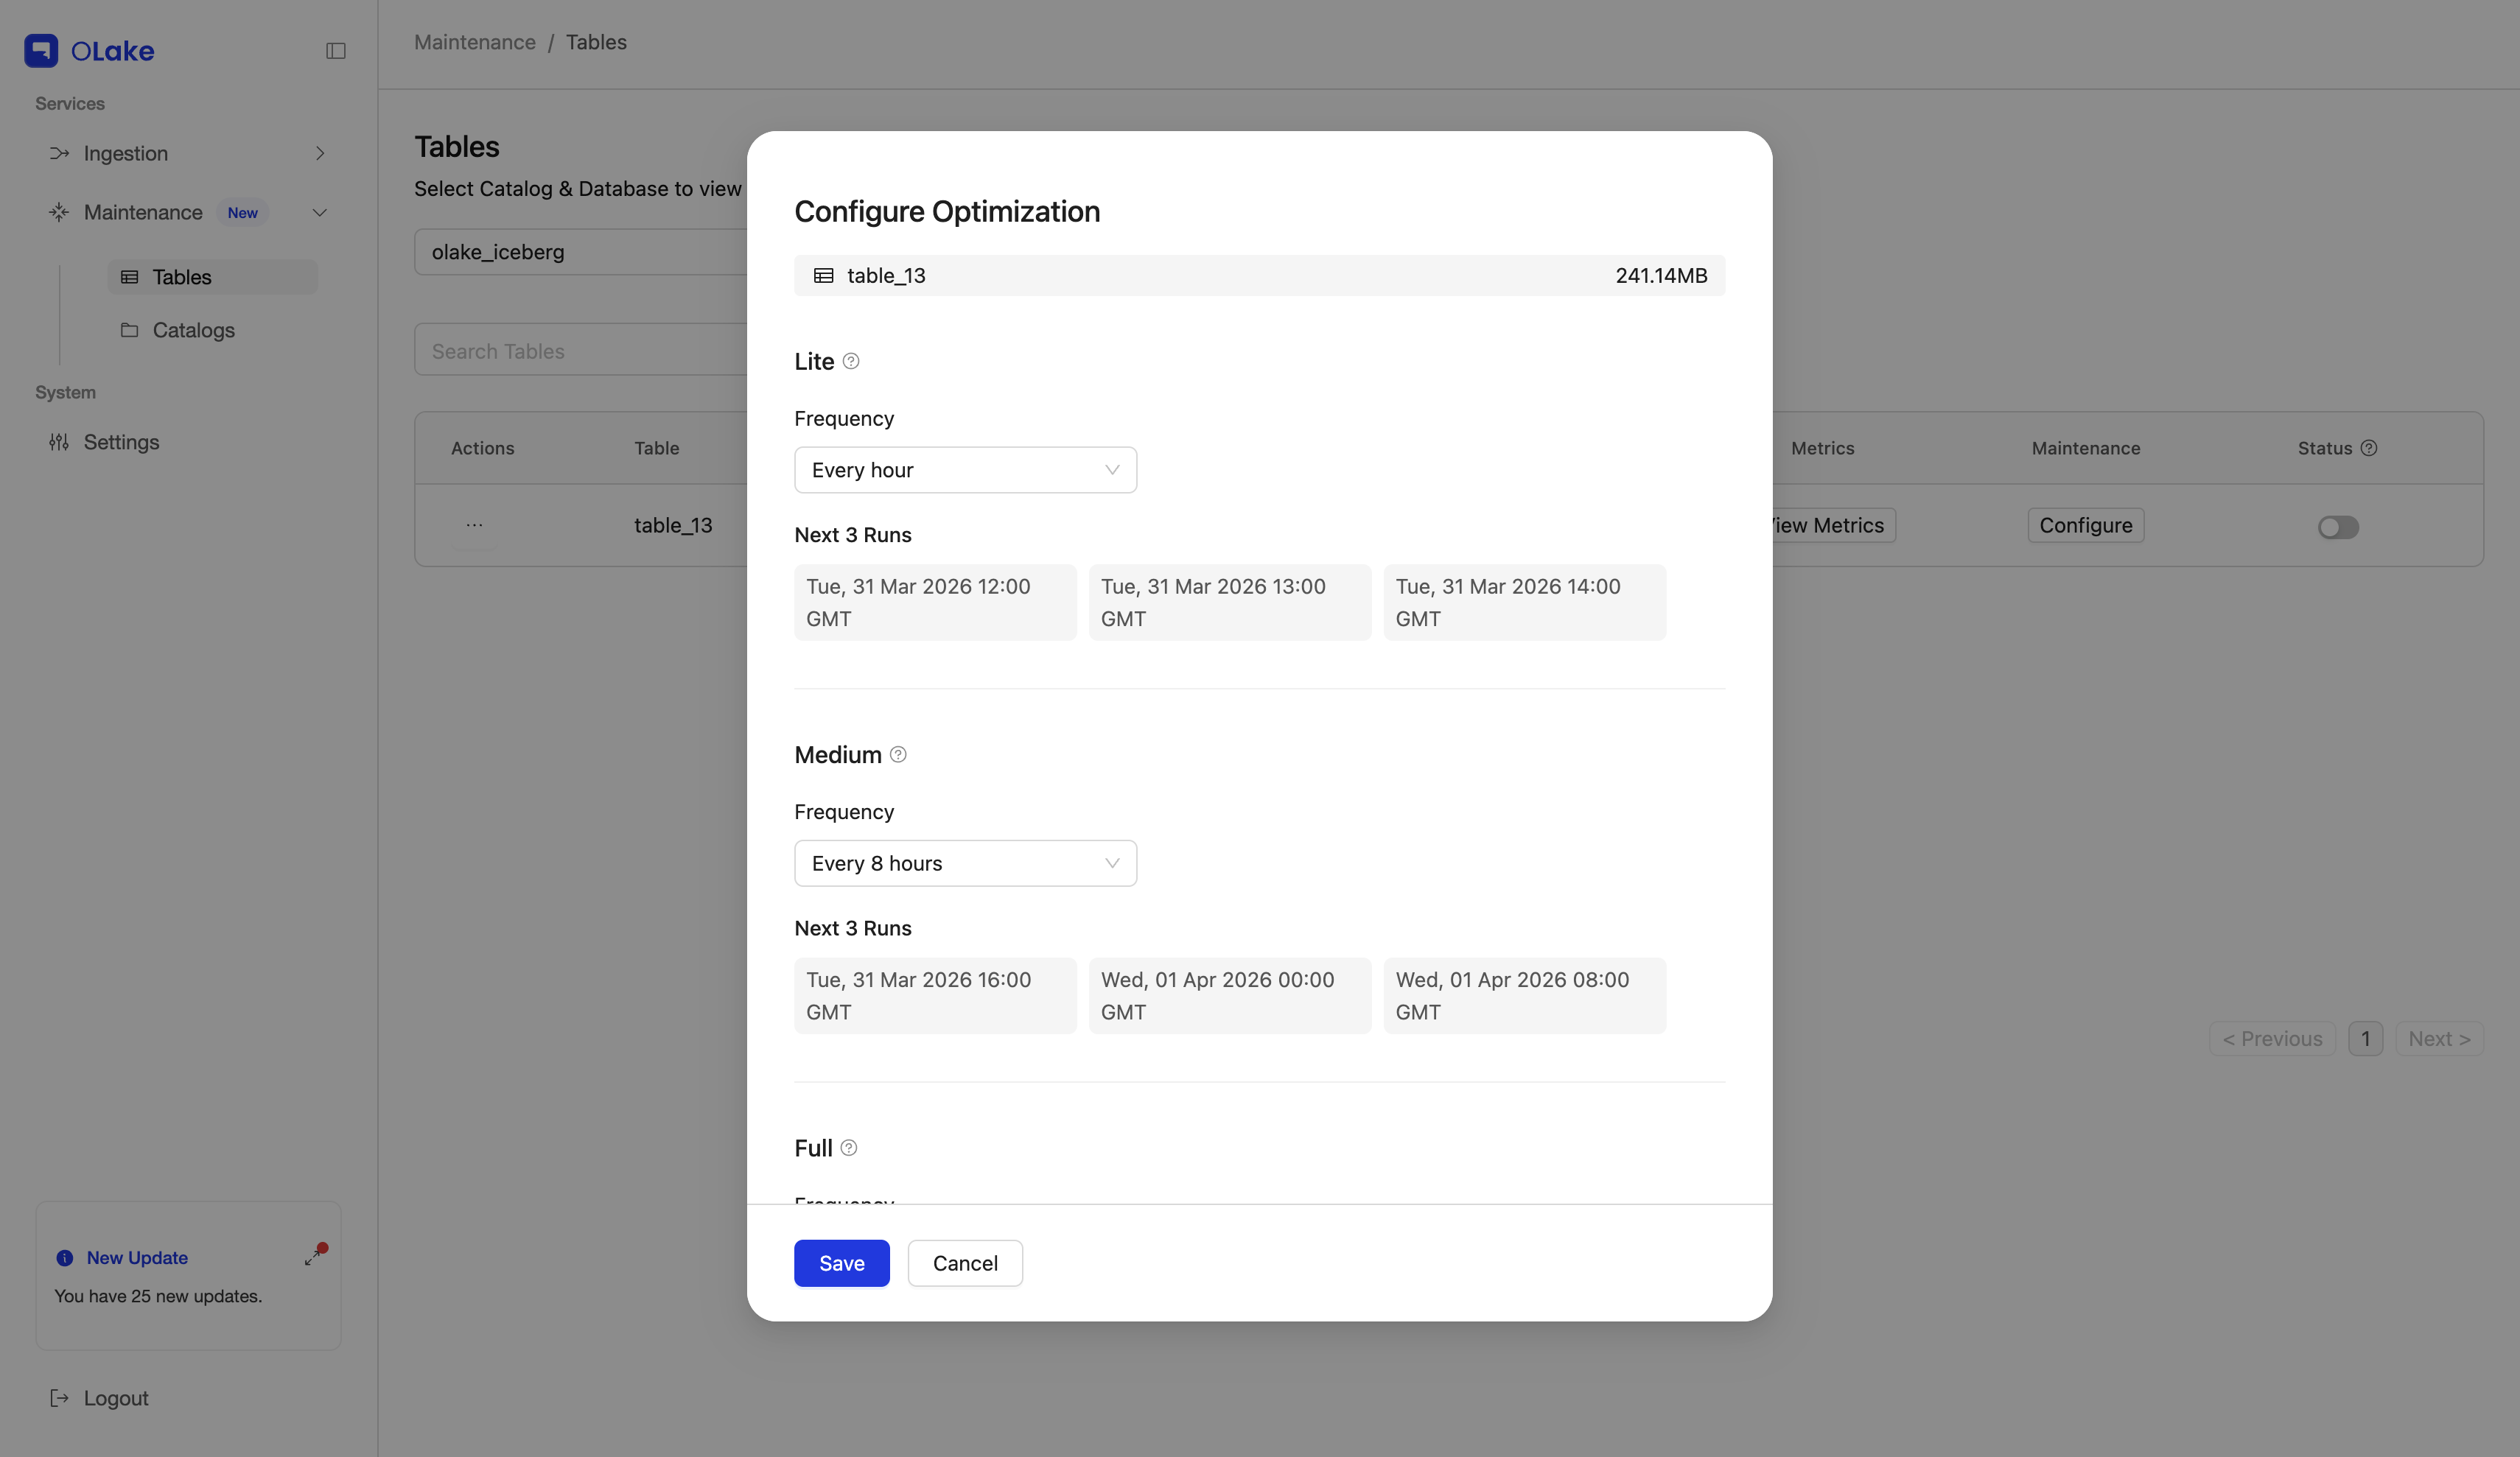
Frequency Presets
When configuring optimization for a table, each optimization type has a Frequency dropdown with common schedules, such as:
- Never
- Every 30 min
- Every hour
- Every 8 hours
- Every 12 hours
- Every 24 hours
You can configure these frequencies independently for Lite, Medium, and Full Optimization.
Default schedules are applied automatically for each table, so there is no need to open the configuration modal and set frequencies on every table unless a different cadence is required.
Defaults schedules for each type of optimization:
Lite — every 1 hour
Medium — every 8 hours
Full — never (not scheduled).
Custom Cron Expression
If you choose Custom in the Frequency dropdown, a Cron Expression field appears.
You can enter a standard cron expression here. For example:
0 0 * * *– run the optimization once every day at midnight.
Step 4: (Advanced) Target File Size
Under the Advanced Config dropdown in the modal, you can configure Target file size.
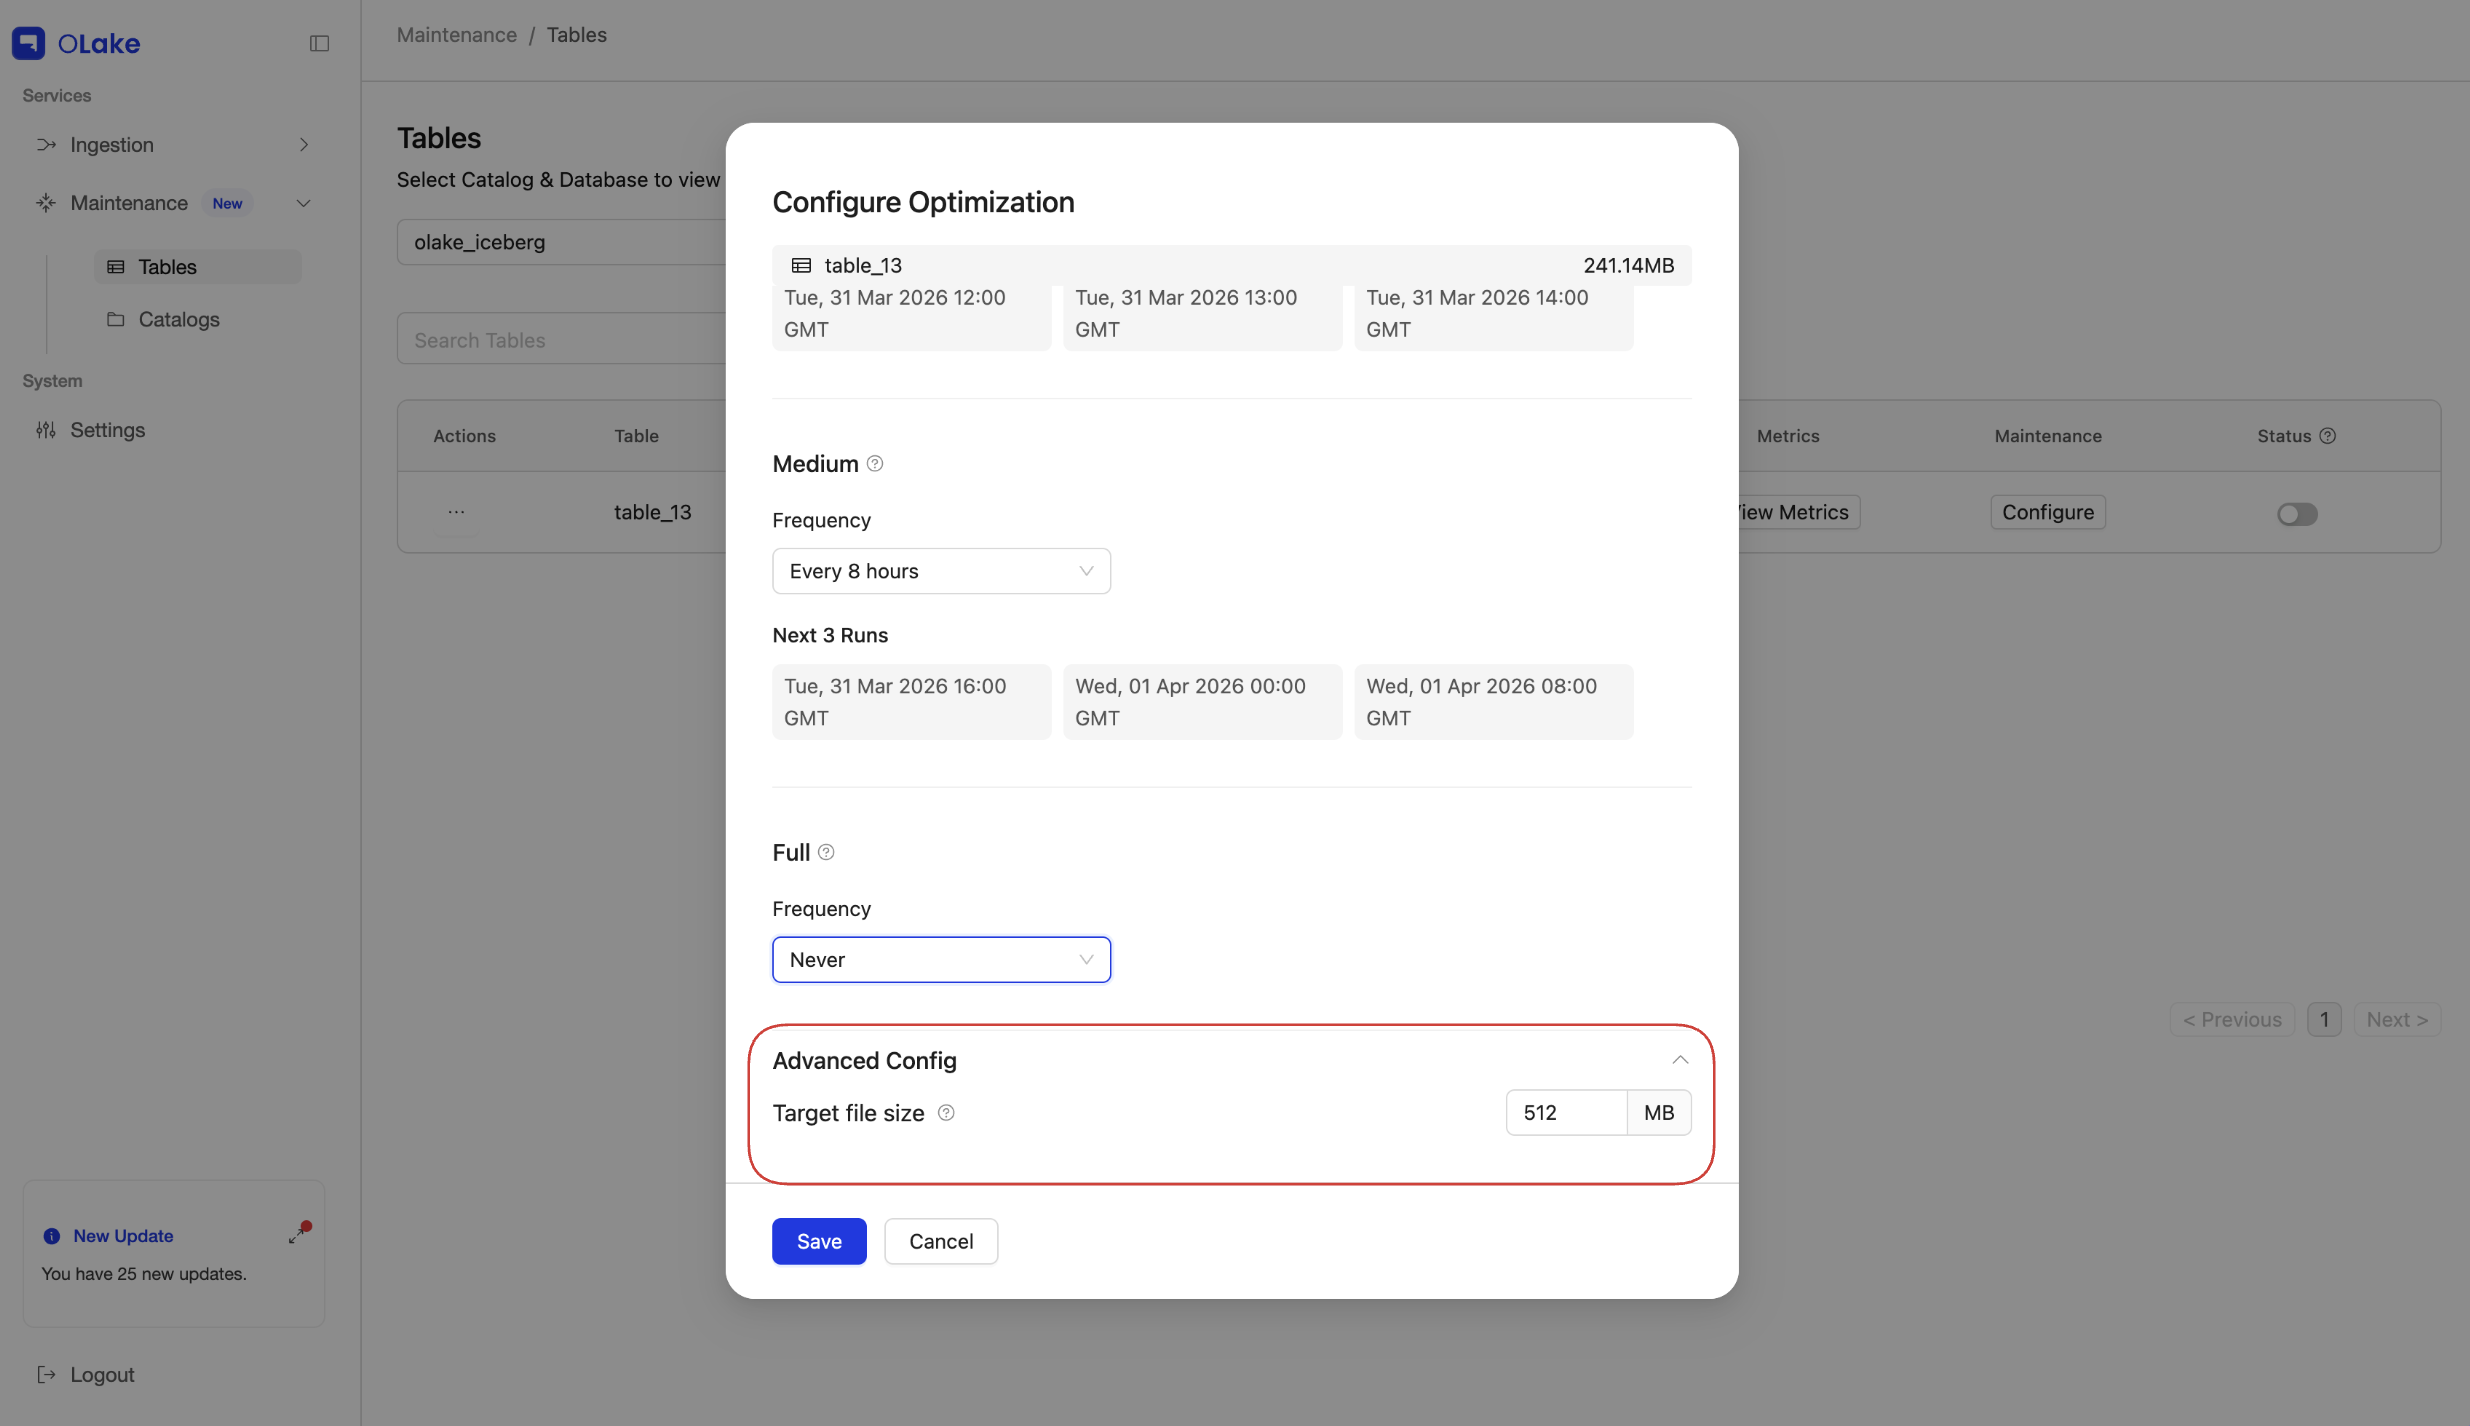
Full Optimization uses target file size directly: rewritten data files are aligned toward that size.
Lite and Medium use it indirectly. Their merge and output bounds are derived from the same setting. How each type relates to this value is explained in the Optimization overview.
In general, a larger target tends toward fewer, bigger files; a smaller target tends toward more, smaller files.
If unsure, start with the default (512 MB) and tune later based on query-engine behavior.
Step 5: Save the Optimization Configuration
After configuring the cron:
- In the modal, click on Save.
- The configuration for that table is saved.
After saving, a Configuration Successful modal appears. It closes automatically after 3 seconds.
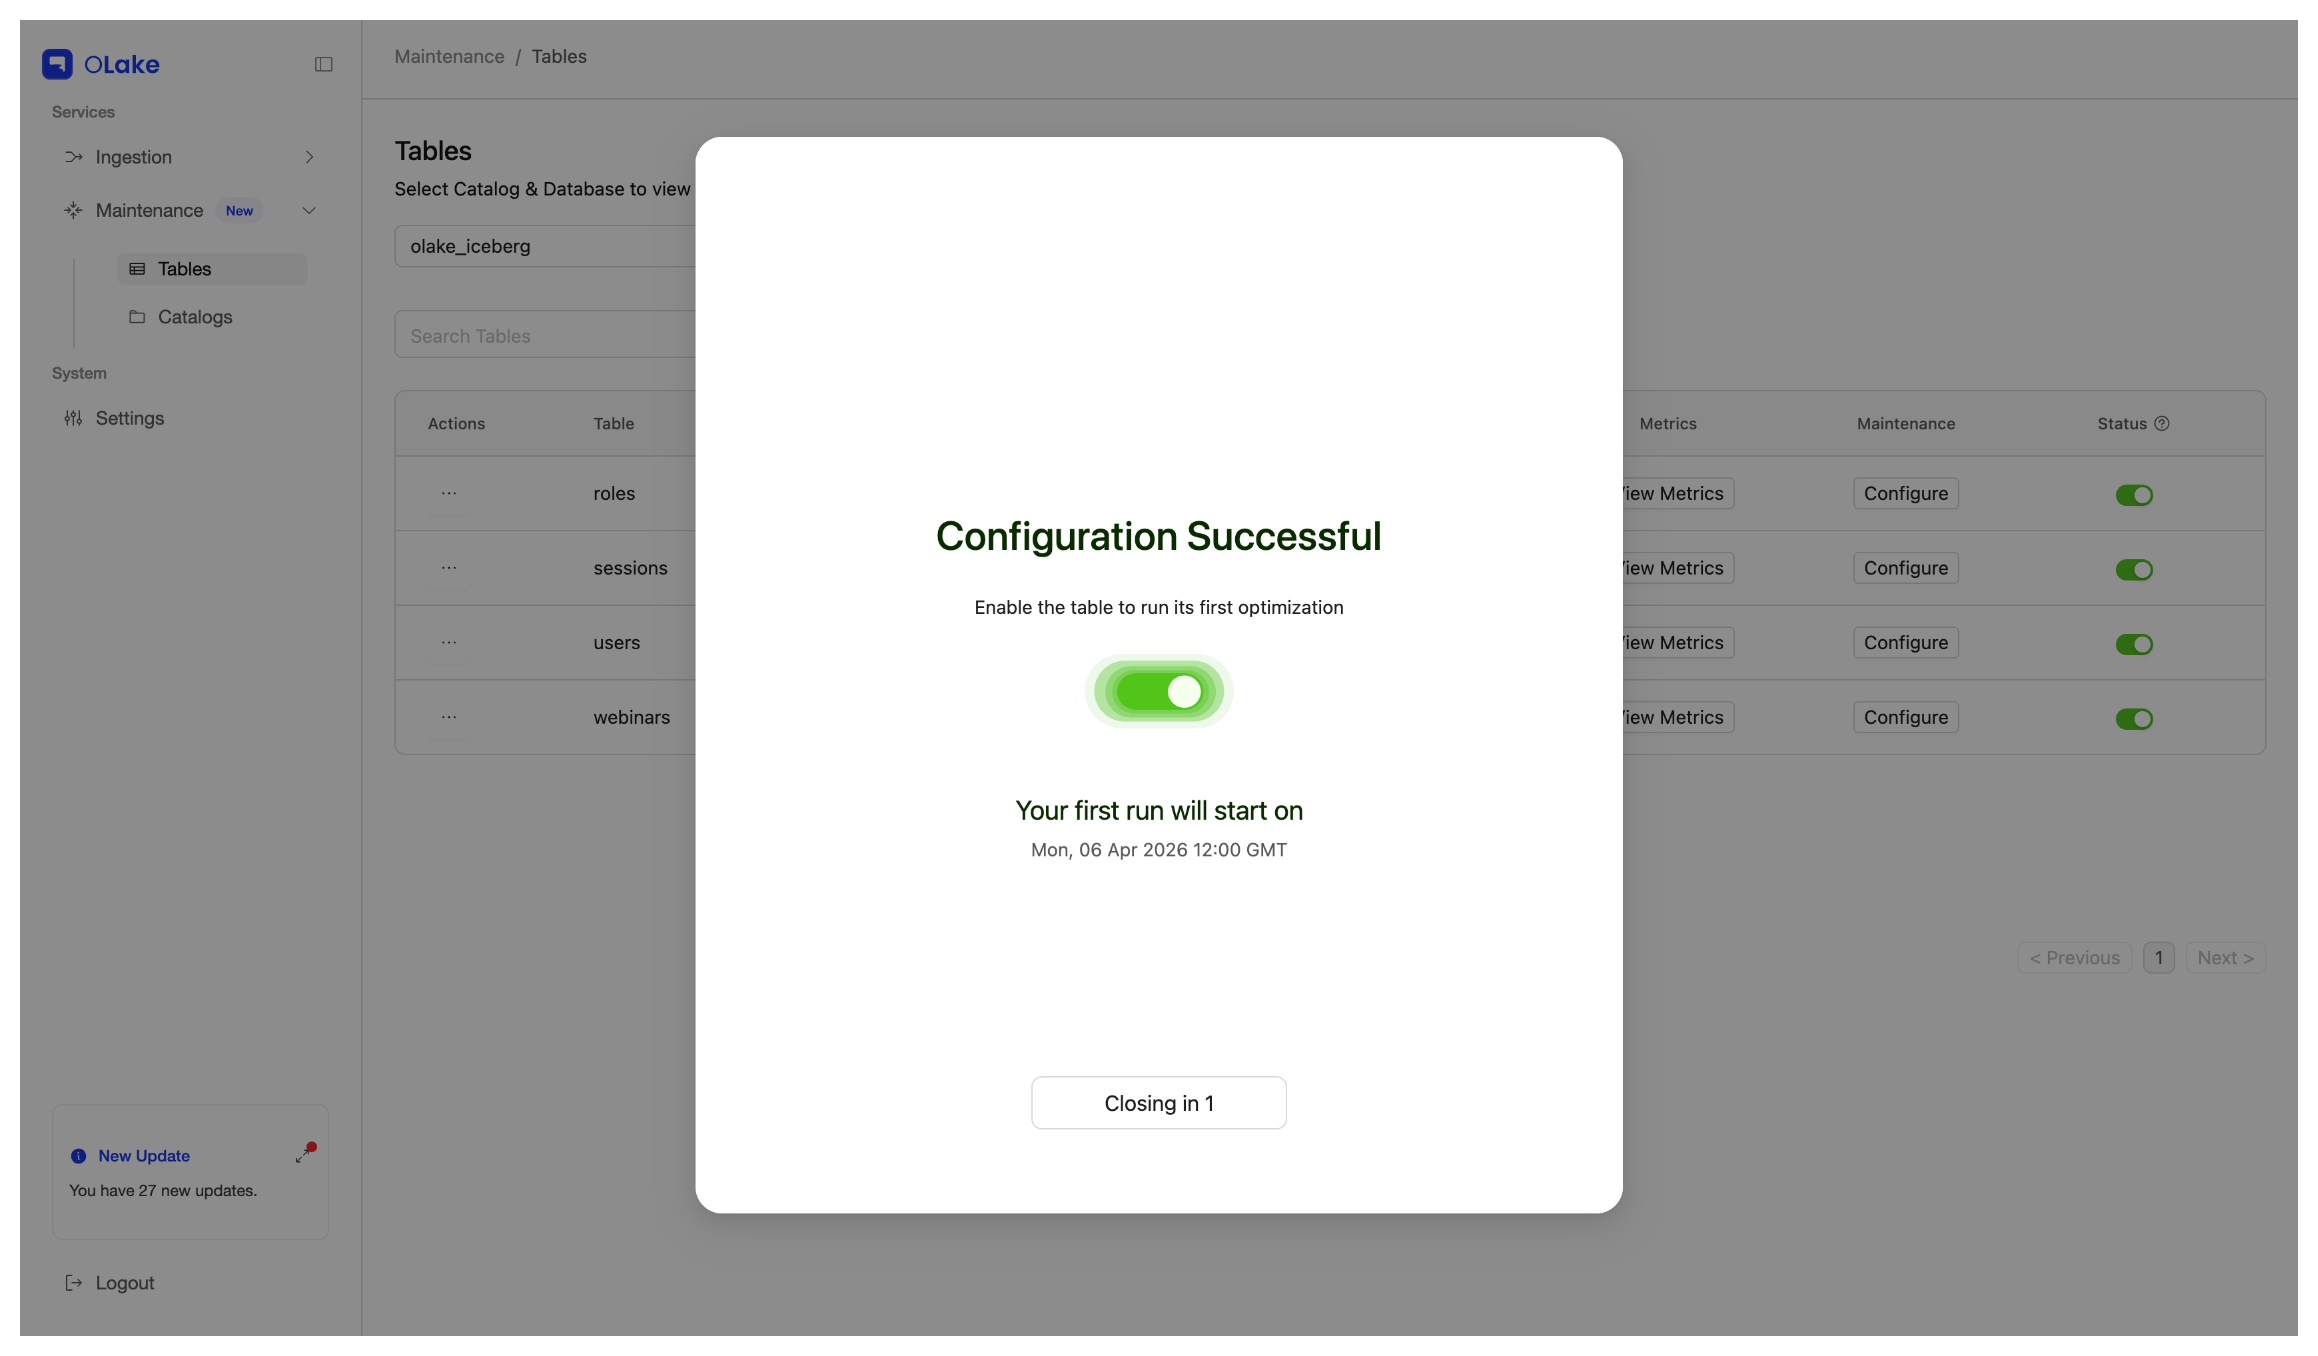
Step 6: Enable the Optimization
Saving the configuration does not start optimization automatically. You must enable it:
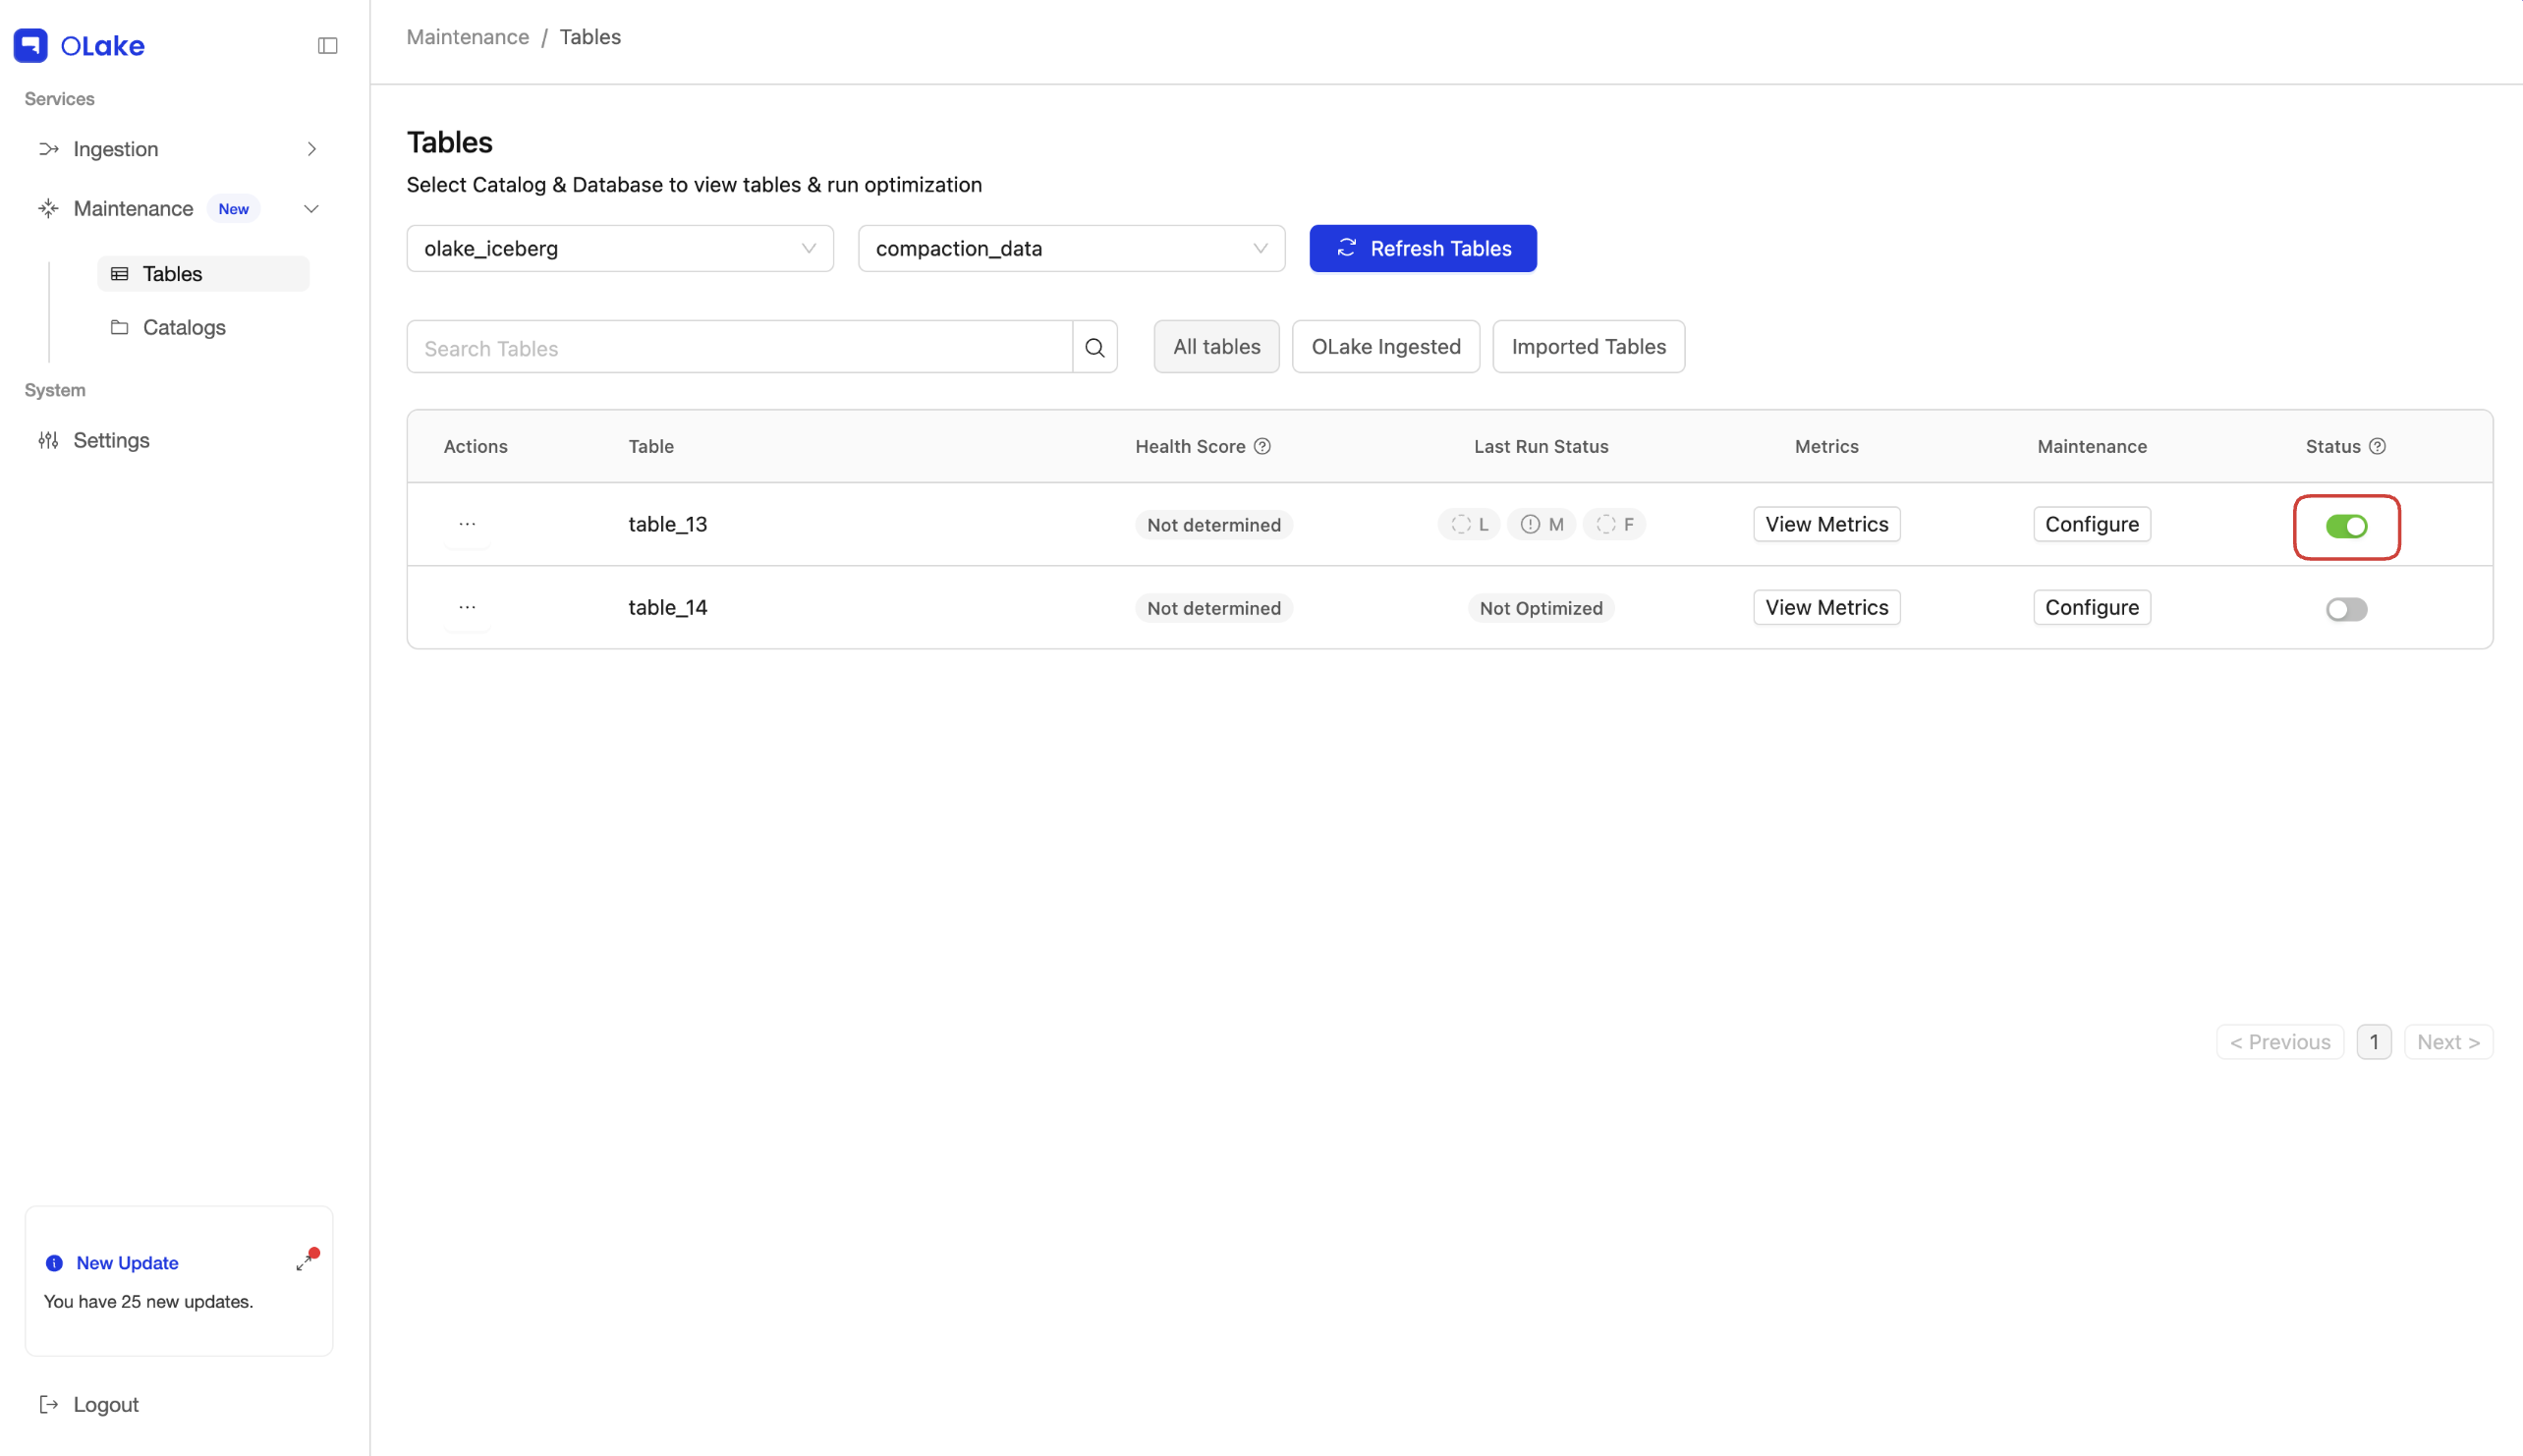
- On the Tables page, locate the Status column next to the Configure button for your table.
- Use the toggle in the Status column to enable the optimization configuration.
Once enabled, OLake will start running optimization for that table according to the schedule you configured.
Health Score and Last Run Status
With a catalog and database selected, the Tables page shows one row per table. The sections below explain Health Score (overall table health) and Last Run status (per-type status for Lite, Medium, and Full optimization).
Health Score
Health Score is a single number that summarises how “healthy” the table looks from OLake’s perspective. It is calculated as:
Health Score = Small Files Score + Eq Delete Score + Pos Delete Score
- Small Files Score — reflects how fragmented or small your data files are.
- Eq Delete Score — reflects equality delete files.
- Pos Delete Score — reflects positional delete files.
Together, these three parts are weighted 40% / 40% / 20%: Small Files Score and Eq Delete Score each contribute 40% of the Health Score, and Pos Delete Score contributes 20%.
Higher scores generally mean the table is in better shape for reads; lower scores suggest running or tuning optimization more often.
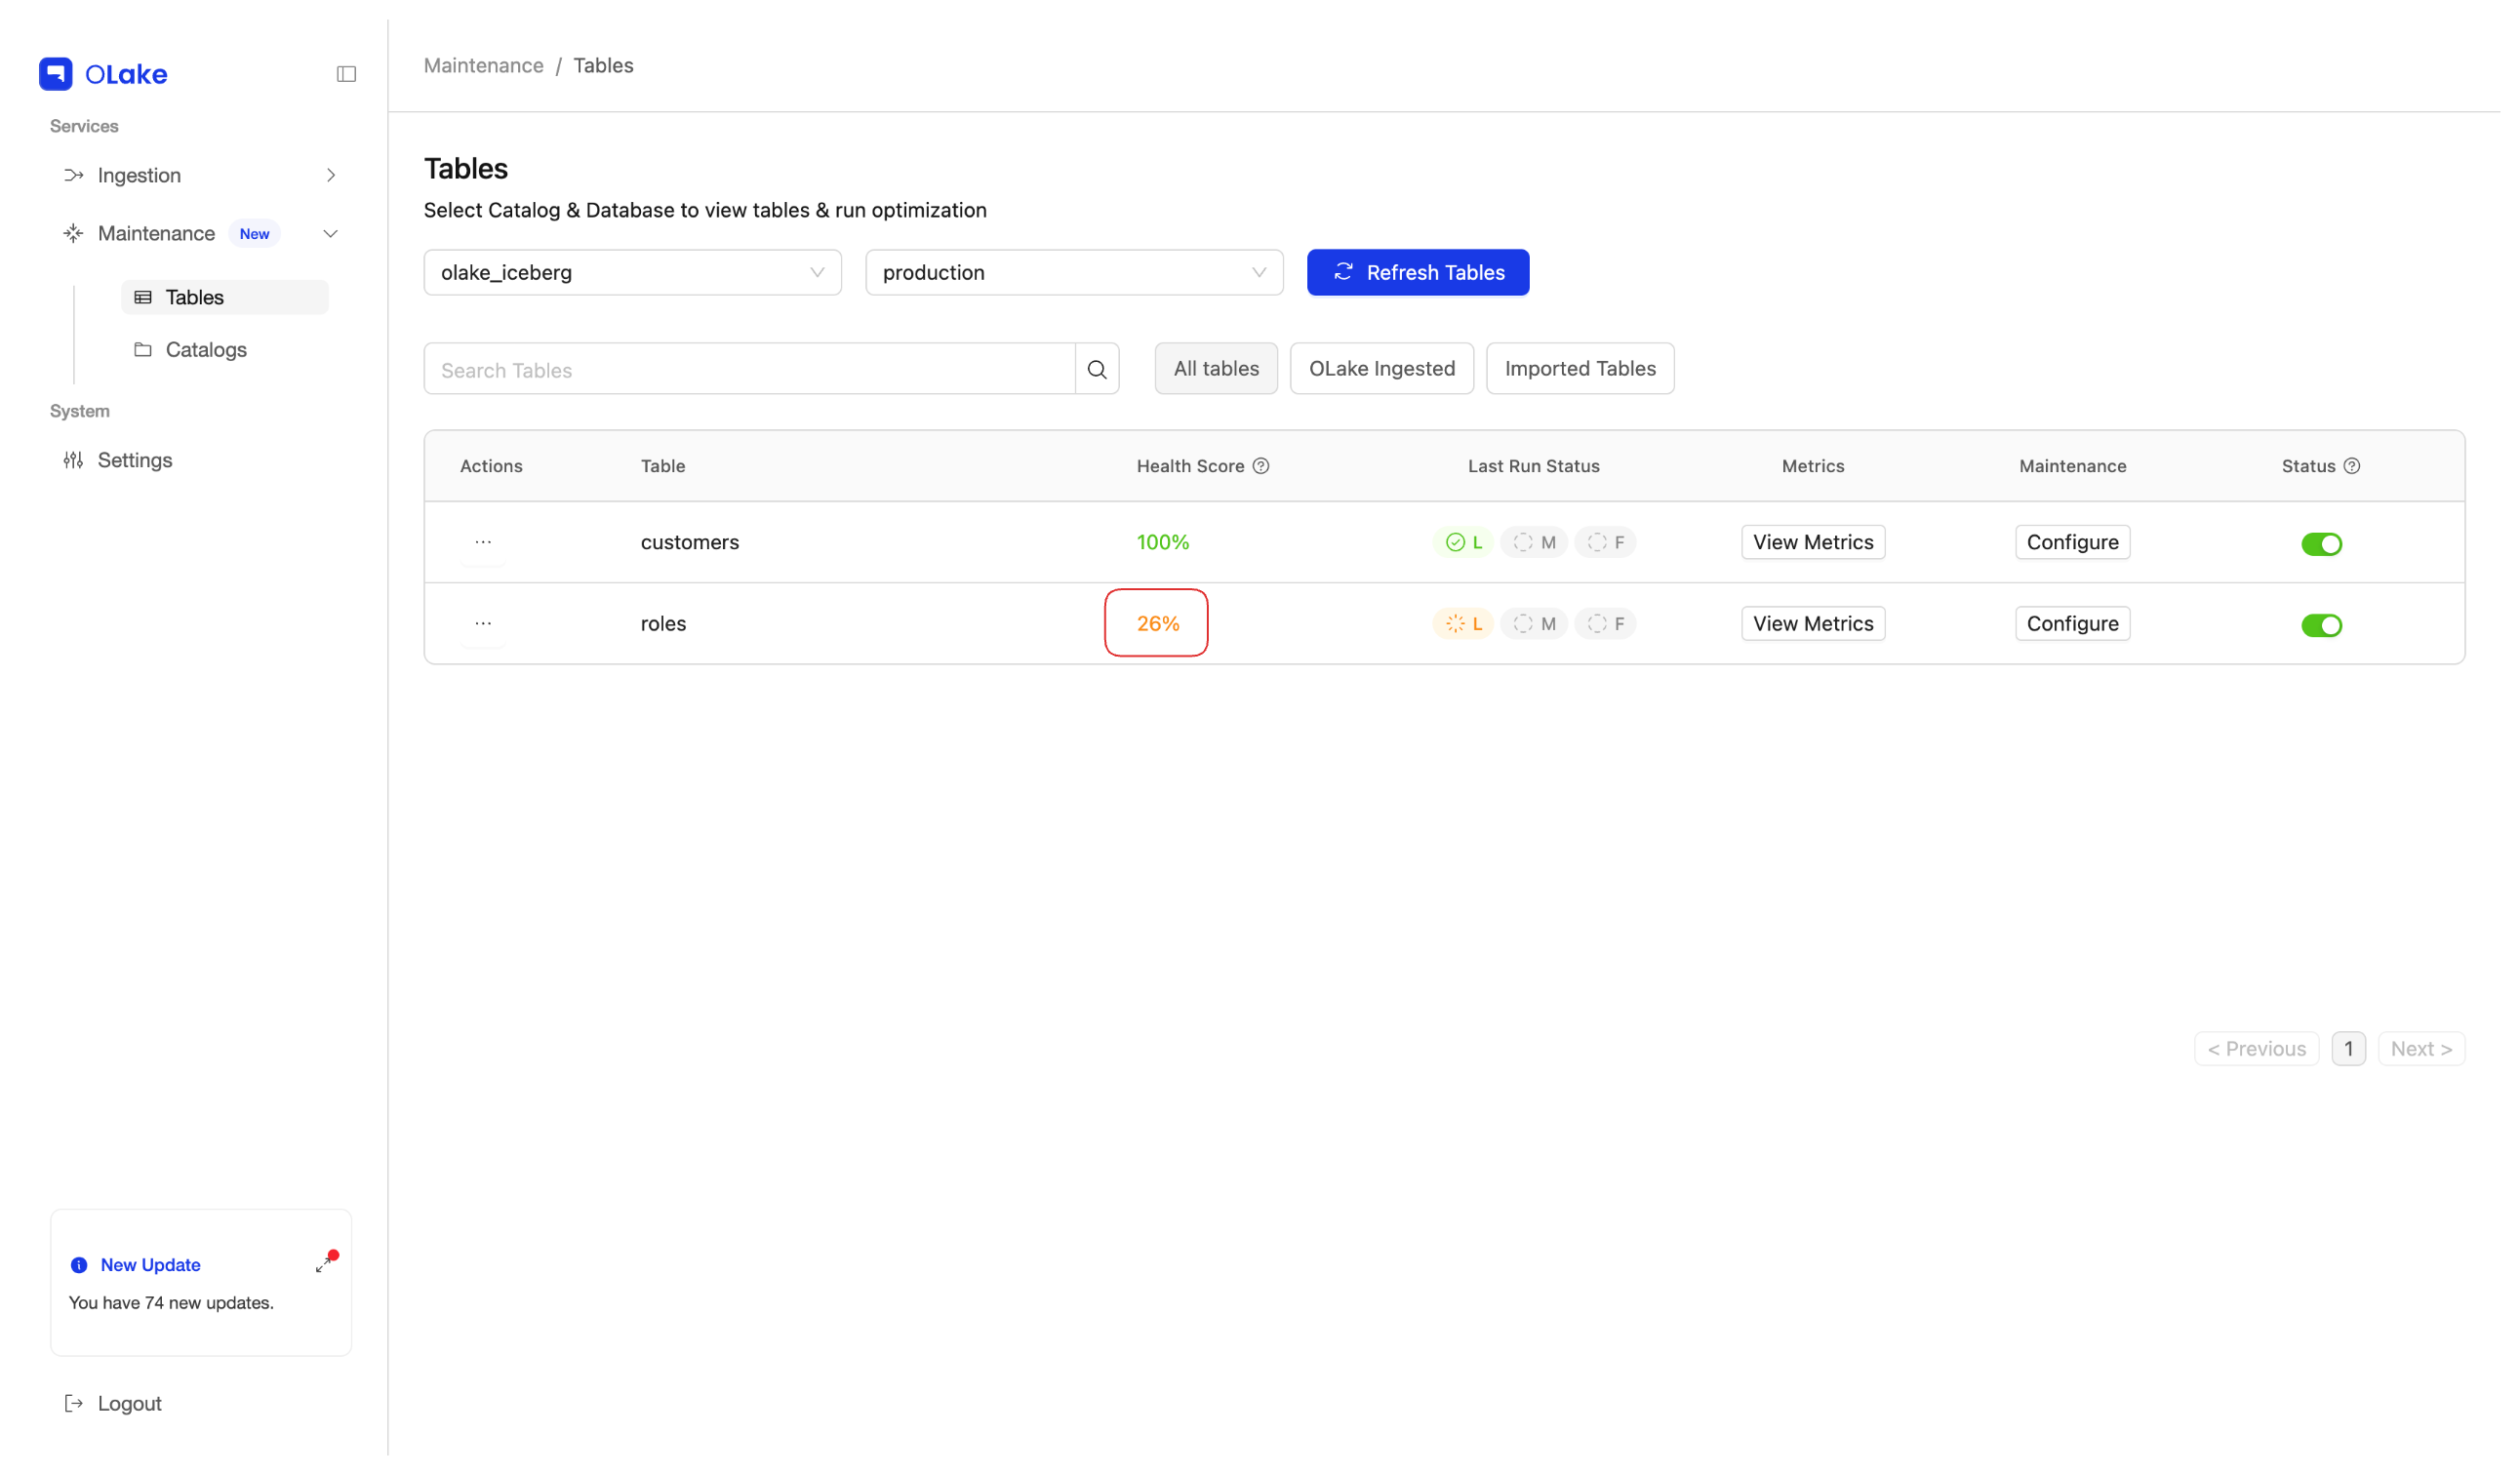
Last Run Status
Last Run status always shows three badges—L (Lite), M (Medium), F (Full). Each badge is that type’s latest outcome: running, success, failed, cancelled, skipped, or never run.
-
Letters — Typically you see three badges together:
- L — Lite Optimization
- M — Medium Optimization
- F — Full Optimization
-
Colours (quick read, per badge)
- Green — that type’s last run succeeded
- Red — that type’s last run failed or was cancelled
- Yellow — a run of that type is running right now
- Gray with ⓘ — that type’s last run was skipped
- Gray with ◌ — that optimization type has never run for this table
-
Not Optimized — Shown only when no optimization has run yet for that table—neither Lite, nor Medium, nor Full.
When you hover over a table's Last Run Status, a small card opens which includes:
- Name — Lite, Medium, or Full
- Last run — relative time, such as “2 hours ago”
- Status — plain text such as Success, Failed, Cancelled, Skipped, or Running

Next Steps
After your first optimization runs, you can:
- View Logs & Runs – see each optimization run and its detailed logs:
Logs & Runs - View Metrics – understand how optimization affecme size as ts file counts, sizes, and health score for your table:
Metrics